Freedom251 › Runtime Monitoring Software
OpenTelemetry Collector
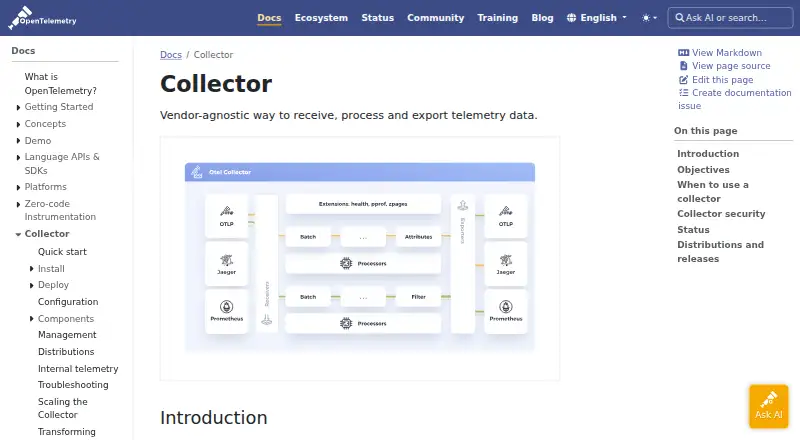
What OpenTelemetry Collector is
OpenTelemetry Collector is an open-source tool for receiving, processing, and exporting telemetry without requiring a vendor-specific flow. It handles traces, metrics, and logs through one codebase, which can be deployed as an agent or collector. Its pipelines combine receivers, processors, exporters, connectors, and extensions; processors can transform, filter, and enrich telemetry in transit. The project offers Core, Contrib, eBPF Profiling, Kubernetes, and OTLP Collector distributions, plus a Builder for assembling custom builds from selected components and added functionality. The Collector is delivered as a single binary and can be deployed in different patterns. It supports open-source formats including Jaeger, Prometheus, and Fluent Bit, and can send data to open-source or commercial backends. Deployed alongside a service, it can handle retries, batching, encryption, and filtering sensitive data before export. The documentation recommends that pattern generally, while direct-to-backend export can work for getting started, development, or small-scale environments. It supports Linux, macOS, Windows, and self-hosted deployment. Security guidance addresses both host infrastructure and Collector configuration. Component stability varies and is documented for individual components.
Who it suits
The Collector suits teams handling traces, metrics, or logs that want a configurable layer between services and telemetry backends. It is recommended alongside services for tasks such as retries, batching, encryption, and sensitive-data filtering; direct export can also suit initial setup, development, or smaller environments.
What it does well
- Receives, processes, and exports traces, metrics, and logs.
- Pipeline processors can transform, filter, and enrich telemetry.
- Supports formats including Jaeger, Prometheus, and Fluent Bit.
- Offers several prebuilt distributions and a custom Builder.
- Can handle retries, batching, encryption, and sensitive-data filtering alongside a service.
- Available for Linux, macOS, Windows, and self-hosted deployment.
What to know first
- Component stability levels vary by component.
- Security guidance calls for securing both infrastructure and Collector configuration.
- Support for software artifacts covers critical bug and security fixes for a period determined by intended audience.
Limits
Component stability is mixed and documented individually in each component's README. Support for Collector software artifacts includes at least critical bug and security fixes, for a period determined by the artifact's intended audience.
Getting started
- Visit https://opentelemetry.io/docs/collector/.
- Choose a prebuilt Core, Contrib, eBPF Profiling, Kubernetes, or OTLP Collector distribution.
- Use the Collector Builder to assemble a custom distribution if needed.
- Deploy the single binary as an agent or collector, choosing a pattern for your use case.
- Configure receivers, processors, exporters, connectors, or extensions for the telemetry pipeline.
- Review the component README stability information and security guidance.
Verdict
Choose OpenTelemetry Collector if you need a vendor-agnostic way to process and route telemetry, with configurable distributions and pipeline components. Review component maturity individually, and secure both its hosting environment and configuration; direct-to-backend export may be a simpler fit for development or small-scale use.
Questions
Does OpenTelemetry Collector cost anything?
It is free and open source, with no trial.
Which telemetry signals does it support?
It supports traces, metrics, and logs through a single codebase.
Which operating systems and deployment options are supported?
Platforms include Linux, macOS, Windows, and self-hosted deployment. The Collector is a single binary that can be deployed as an agent or collector.
Can I build a customized distribution?
Yes. The OpenTelemetry Collector Builder can create a distribution using selected components and custom functionality.
Which telemetry formats does it support?
The documentation lists open-source formats including Jaeger, Prometheus, and Fluent Bit. Data can be sent to open-source or commercial backends.
How mature are the Collector components?
Stability levels vary across components, and each component's README documents its level.
Facts from OpenTelemetry Collector's own pages
- Artifact verification
- The Collector repository documents Cosign verification for the official Collector and Contrib container images. · github.com, 30 Sept 2026
- Audience
- The documentation recommends using a Collector alongside services generally, while noting that direct-to-backend export can work for getting started or for development and small-scale environments. · opentelemetry.io, 30 Sept 2026
- Component maturity
- Collector component stability levels are mixed and documented individually in each component’s README. · opentelemetry.io, 30 Sept 2026
- Customization
- The OpenTelemetry Collector Builder can build custom distributions with selected components and custom functionality. · opentelemetry.io, 30 Sept 2026
- Data handling
- The Collector can handle retries, batching, encryption, and sensitive data filtering when deployed alongside a service. · opentelemetry.io, 30 Sept 2026
- Deployment
- It can run as an agent or gateway, and supports deployment patterns including Docker and Kubernetes. · opentelemetry.io, 30 Sept 2026
- Distribution options
- The project offers prebuilt Core, Contrib, eBPF Profiling, Kubernetes, and OTLP Collector distributions. · opentelemetry.io, 30 Sept 2026
- Integrations
- The docs list support for open source telemetry formats including Jaeger, Prometheus, and Fluent Bit, with data sent to open source or commercial backends. · opentelemetry.io, 30 Sept 2026
- Maturity
- The Collector has mixed status because its core components have mixed stability levels, which are documented per component. · opentelemetry.io, 30 Sept 2026
- Pipeline components
- Its pipeline components include receivers, processors, exporters, connectors, and extensions. · opentelemetry.io, 30 Sept 2026
- Platforms
- The installation documentation says the Collector can be deployed on a variety of operating systems and architectures, with binary installation instructions for Linux, macOS, and Windows. · opentelemetry.io, 30 Sept 2026
- Processing
- Processors transform, filter, and enrich telemetry as it flows through the pipeline. · opentelemetry.io, 30 Sept 2026
- Purpose
- OpenTelemetry Collector receives, processes, and exports telemetry data in a vendor-agnostic way. · opentelemetry.io, 30 Sept 2026
- Security
- The security guidance recommends securing both hosting infrastructure and Collector configuration to help protect sensitive telemetry, prevent tampering and denial of service, and support regulatory compliance. · opentelemetry.io, 30 Sept 2026
- Signals
- The Collector supports traces, metrics, and logs through a single codebase that can be deployed as an agent or collector. · opentelemetry.io, 30 Sept 2026
- Support
- Support for Collector software artifacts includes, at minimum, fixes for critical bugs and security issues for a period determined by the artifact’s intended audience. · opentelemetry.io, 30 Sept 2026
- Who it is for
- The Collector is recommended alongside services to handle tasks such as retries, batching, encryption, and filtering sensitive data before export. · opentelemetry.io, 30 Sept 2026
Where OpenTelemetry Collector stands on Freedom251
- Runtime Monitoring Software#30 of 56
- Telemetry Pipeline Software#16 of 28