Freedom251 › Runtime Monitoring Software
Pinpoint
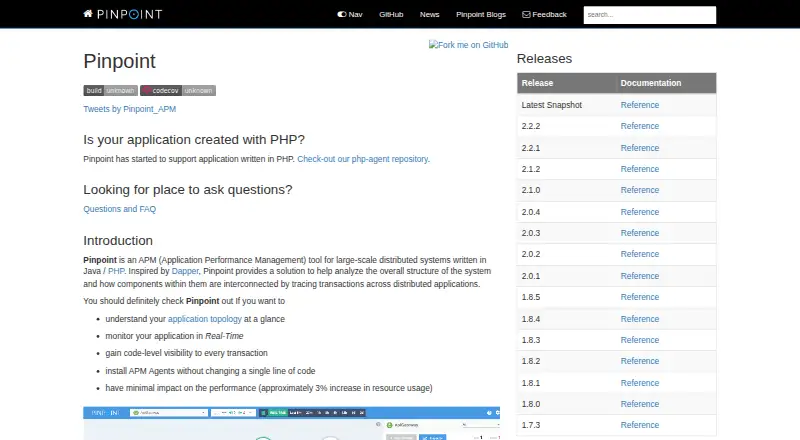
What Pinpoint is
Pinpoint is a free application performance management tool for distributed systems built with Java, PHP, and Python. It traces transactions across application components to help locate bottlenecks and problem areas. Its ServerMap presents system topology alongside component status and transaction counts, while CallStack views expose code-level transaction details. Monitoring views include a real-time active-thread chart, a request-and-response scatter chart, and an application inspector for CPU use, memory and garbage collection, transactions per second, and JVM arguments. The Pinpoint Agent uses bytecode instrumentation to trace calls without changes to application code; the project describes the resulting resource-usage increase as approximately 3%. Production collection can sample 1–5% of requests, and technical details also describe a counting sampler. Documented modules include Tomcat, Jetty, Spring, Kafka, MySQL, Redis, and RabbitMQ. Pinpoint is Apache License 2.0 software and can be self-hosted. A self-managed instance requires HBase, Pinpoint Collector, Pinpoint Web, and an Agent attached to a Java application. The Web module tracks selected interface clicks, with a documented option to disable collection.
Who it suits
Pinpoint suits teams monitoring large-scale distributed applications written in Java, PHP, or Python. It is a fit for users prepared to manage a self-hosted deployment and its HBase storage backend.
What it does well
- Free under Apache License 2.0.
- Traces transactions across application components.
- ServerMap shows topology, status, and transaction counts.
- Bytecode instrumentation avoids application code changes.
- Includes live monitoring and code-level trace views.
What to know first
- Self-managed setup requires HBase, Collector, Web, and an Agent.
- Documented deployment requires an Agent attached to a Java application.
- Web module tracks selected UI clicks unless disabled.
Limits
A self-managed instance requires HBase, Pinpoint Collector, Pinpoint Web, and an Agent attached to a Java application. The project describes production collection sampling 1–5% of requests, with a counting sampler also available.
Plans
| Plan | Billed and limits | Price |
|---|---|---|
| Pinpoint | Apache License 2.0 · self-hosted deployment | Free |
As pinpoint-apm.github.io lists them, read 5 Oct 2026. The maker's own page has the final word.
Getting started
- Visit the Pinpoint project website.
- Prepare HBase as the storage backend.
- Install Pinpoint Collector and Pinpoint Web.
- Attach a Pinpoint Agent to a Java application.
- Review the documented configuration for disabling click tracking if needed.
Verdict
Pinpoint combines distributed transaction tracing with topology, live monitoring, and application inspection. Its self-hosted requirements and documented click tracking setting are worth reviewing before deployment.
Questions
Is Pinpoint free?
Yes. The Pinpoint plan is free under the Apache License 2.0.
Can Pinpoint be self-hosted?
Yes. Pinpoint is self-hosted; a self-managed instance requires HBase, Pinpoint Collector, Pinpoint Web, and an Agent attached to a Java application.
Which application languages does Pinpoint support?
The project says it supports applications written in Java, PHP, and Python.
What does Pinpoint show about an application?
Its ServerMap shows system topology, component status, and transaction counts. The Inspector displays CPU use, memory and garbage collection, TPS, and JVM arguments.
Does Pinpoint require application code changes for tracing?
The Pinpoint Agent uses bytecode instrumentation to trace calls without requiring application code modifications.
Does Pinpoint collect interface click data?
The Web module tracks the number and order of selected clicks in several views. The project documents a configuration option to disable this tracking.
Facts from Pinpoint's own pages
- Application metrics
- Inspector displays CPU usage, memory and garbage collection, TPS, and JVM arguments. · pinpoint-apm.github.io, 5 Oct 2026
- Deployment
- The installation guide says a self-managed instance requires HBase, Pinpoint Collector, Pinpoint Web, and an Agent attached to a Java application. · pinpoint-apm.github.io, 5 Oct 2026
- Distributed tracing
- It traces transaction flows across application components to help identify problem areas and bottlenecks. · pinpoint-apm.github.io, 5 Oct 2026
- Founded
- 2012 · pinpoint-apm.github.io, 28 Sept 2026
- Instrumentation
- The Pinpoint Agent uses bytecode instrumentation to trace calls without requiring application code modifications. · pinpoint-apm.github.io, 5 Oct 2026
- Integrations
- The supported modules list includes technologies such as Tomcat, Spring Boot, gRPC, Kafka, MySQL, Redis, and MongoDB. · github.com, 5 Oct 2026
- License
- Pinpoint is licensed under the Apache License, Version 2.0. · github.com, 5 Oct 2026
- Live monitoring
- The Realtime Active Thread Chart monitors active threads inside applications in real time. · pinpoint-apm.github.io, 5 Oct 2026
- Monitoring views
- The interface includes a real-time active-thread chart, a request/response scatter chart, call-stack views, and an application inspector. · pinpoint-apm.github.io, 5 Oct 2026
- Open source license
- Pinpoint is licensed under the Apache License, Version 2.0. · pinpoint-apm.github.io, 5 Oct 2026
- Performance overhead
- The home page describes the resource-usage increase as approximately 3%. · pinpoint-apm.github.io, 5 Oct 2026
- Product
- Pinpoint is an application performance management tool for large-scale distributed systems written in Java and PHP. · pinpoint-apm.github.io, 5 Oct 2026
- Purpose
- Pinpoint is an APM tool for large-scale distributed systems that traces transactions across distributed applications. · github.com, 5 Oct 2026
- Resource impact
- The project describes Pinpoint's resource usage increase as approximately 3%. · github.com, 5 Oct 2026
- Sampling
- The technical details page says production environments can collect a 1–5% sample of requests and describes a counting sampler. · pinpoint-apm.github.io, 5 Oct 2026
- Security and privacy
- The Web module tracks the number and order of selected UI clicks with Google Analytics, and the project documents a setting to disable this collection. · pinpoint-apm.github.io, 5 Oct 2026
- Server map
- The ServerMap visualizes distributed-system topology and shows component status and transaction counts. · pinpoint-apm.github.io, 5 Oct 2026
- Storage requirement
- The installation guide says Pinpoint uses HBase as the storage backend for the Collector and Web. · pinpoint-apm.github.io, 5 Oct 2026
- Support
- The project site links to a questions and FAQ page for users seeking help. · pinpoint-apm.github.io, 5 Oct 2026
- Supported application languages
- The project says it supports applications written in Java, PHP, and Python. · github.com, 5 Oct 2026
- Topology view
- ServerMap visualizes distributed system components and shows component status and transaction counts. · pinpoint-apm.github.io, 5 Oct 2026
- Trace analysis
- CallStack provides code-level visibility into transactions to help identify bottlenecks and failures. · pinpoint-apm.github.io, 5 Oct 2026
- Usage telemetry
- The Web module tracks the number and order of clicks in the Server Map, Transaction List, and Inspector View; the page documents a configuration option to disable this tracking. · pinpoint-apm.github.io, 5 Oct 2026
Where Pinpoint stands on Freedom251
- Runtime Monitoring Software#26 of 56
- Distributed Tracing Tools#16 of 32