LLDB
What LLDB is
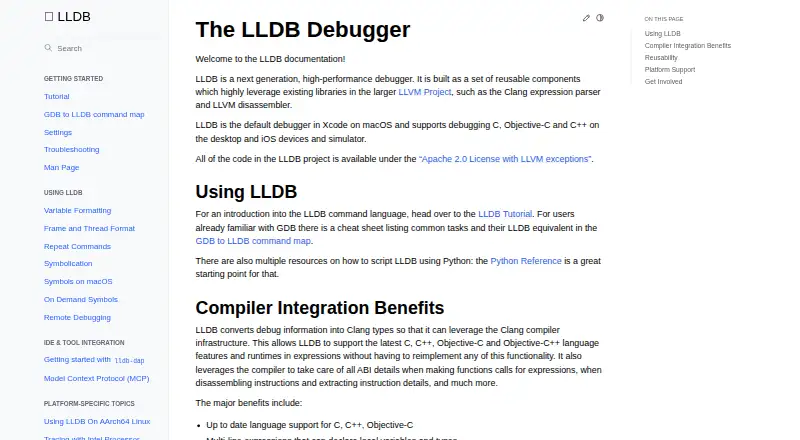
LLDB is a free debugger built from reusable components that use LLVM libraries, including the Clang expression parser and LLVM disassembler. It is the default debugger in Xcode on macOS and supports debugging C, C++, and Objective-C on desktop and iOS devices and simulators. Its tools include breakpoints, watchpoints, process launching, and attaching to programs. Expression evaluation handles current C-family language features and multiline expressions, with just-in-time evaluation where supported. LLDB provides a public C++ API through a shared library and Python bindings; these can support scripting, symbolication, disassembly, and inspection of object and symbol files. The lldb-dap adapter exposes LLDB features to compatible editors and IDEs such as Visual Studio Code, Emacs, vim, and neovim. Documented adapter requests include several breakpoint types, memory reading and writing, and disassembly. LLDB's code is available under the Apache 2.0 License with LLVM exceptions. Windows support is still under active development, and ARM and AArch64 support is described as more experimental.
Who it suits
LLDB suits developers working with C, C++, Objective-C, or Objective-C++ who need debugging on supported desktop or mobile targets. Its API and Python bindings also suit developers building scripting or inspection workflows.
What it does well
- Free and open source under Apache 2.0 with LLVM exceptions.
- Default debugger in Xcode on macOS.
- Supports breakpoints, watchpoints, launching, and attaching.
- Provides C++ API and Python bindings.
- Remote debugging includes Linux, Windows, Android, and iOS.
What to know first
- Windows support remains under active development.
- ARM and AArch64 support is more experimental.
- lldb-dap does not support step-back.
- lldb-dap does not support setting a variable.
Plans
| Plan | Billed and limits | Price |
|---|---|---|
| LLDB | Open source debugger | Free |
As lldb.llvm.org lists them, read 30 Sept 2026. The maker's own page has the final word.
Getting started
- Visit the LLDB website for documentation
- Obtain lldb-dap from a toolchain, LLVM release package, or system package manager, or build it from source
- Use LLDB with Xcode on macOS, or connect lldb-dap to a compatible editor or IDE
LLDB is an open-source debugger for developers working with C, C++, Objective-C, or Objective-C++ code. It is the natural fit for Xcode users and for teams that want a debugger they can embed or script. Its broad debugger and API capabilities come with uneven support across platforms and no time-travel debugging.
Overview
LLDB is built from reusable components drawing on LLVM libraries, including Clang’s expression parser and LLVM’s disassembler. It can launch programs, attach to running processes, and work with breakpoints and watchpoints. The project code is licensed under Apache 2.0 with LLVM exceptions, making LLDB a capable no-cost option for individual developers and teams that can accommodate its platform-specific limitations.
Key features
Expression evaluation and control
Clang-based expression evaluation covers current C, C++, Objective-C, and Objective-C++ language features. Multiline expressions and just-in-time evaluation are supported where the context allows them, which is useful when inspecting or evaluating code during a debugging session. Conditional and exception breakpoints, watchpoints, and core-dump debugging cover common ways to narrow down failures, but LLDB does not offer time-travel debugging for tracing execution backward.
APIs, scripting, and editor integration
A public object-oriented C++ API is exposed through a shared library, with Python bindings for scripting. That gives developers room to build tooling around the debugger; the API can also support symbolication, disassembly, and inspection of object and symbol files. LLDB also documents an integration using the Model Context Protocol.
For compatible editors and IDEs, lldb-dap exposes LLDB through the Debug Adapter Protocol. It documents function, conditional, data, and instruction breakpoints, along with memory read and write and disassembly requests. It does not support step-back, setting a variable, goto-target, or terminate requests, so editor users should check whether those omissions matter to their workflow. The lldb-dap binary can come from an LLVM release package, a toolchain or system package manager, or a source build.
Remote debugging and configuration
LLDB documents remote debugging for Linux, Windows, Android, and iOS, extending its use beyond programs running on the debugger’s own system. For security, it does not source a current-directory .lldbinit file by default; developers relying on project-local startup configuration need to account for that safeguard.
Pricing
LLDB’s free plan costs nothing and is open source; there is no free trial because the software is free to use. It supports C, C++, Objective-C, and Objective-C++, with targets including macOS, iOS, tvOS, watchOS, Linux, FreeBSD, NetBSD, Windows, and Android. There are no paid tiers or seat limits to weigh against the free plan. Its main trade-off is not price but platform maturity: Windows support is under active development, and ARM and AArch64 support there is more experimental.
Platforms
LLDB is the default debugger in Xcode on macOS, and its documented language support covers debugging C, Objective-C, and C++ on desktop and iOS devices and simulators. The project lists macOS, Linux, FreeBSD, NetBSD, and Windows support, while the plan’s target platforms also include iOS, tvOS, watchOS, and Android. Windows users should expect an actively developing implementation rather than the same level of assurance as established targets; ARM and AArch64 on Windows are especially experimental. Check target-specific support before committing a workflow to those configurations.
Who it's for
LLDB is best suited to developers already using Xcode, LLVM-based toolchains, or editors with Debug Adapter Protocol support, especially when C-family debugging and scripting or embedding through the API are priorities. It is less suitable for teams that require time-travel debugging, need every DAP request supported, or depend on mature Windows ARM-family debugging. Documentation points users to a forum or LLVM Discord for discussion and provides routes for bug reports and code reviews, which may suit developers comfortable engaging with an open-source project community.
Pros and cons
- Pros: Free, open-source access to a debugger with C-family expression evaluation, breakpoints, watchpoints, and core-dump debugging makes it useful across a range of development workflows.
- Pros: The public C++ API and Python bindings support custom tooling, while lldb-dap connects the debugger to compatible editors and IDEs.
- Pros: Remote debugging and documented mobile targets extend LLDB beyond local desktop sessions.
- Cons: No time-travel debugging means developers cannot use LLDB to step backward through execution.
- Cons: lldb-dap lacks step-back, variable-setting, goto-target, and terminate requests, which can constrain editor-driven debugging.
- Cons: Windows is still under active development, with ARM and AArch64 support more experimental.
Alternatives
Browse other debuggers if LLDB’s platform maturity or workflow limits do not fit your needs.
- Delve is a free alternative for readers considering a debugger on Linux, macOS, Windows, or a self-hosted setup.
- IDA Pro is an alternative for readers who need disassembly: IDA Free costs nothing and covers x86-32 and x86-64 disassembly with two cloud-based decompilers on a named license; IDA Pro Essential costs 1099.00 USD.
- Xdebug is a freemium alternative for Linux, macOS, Windows, web, or self-hosted environments; its Pro plan is £200 a year for one developer and includes e-mail technical support.
- FlowStorm is a free and open-source option for Linux, macOS, Windows, or self-hosted use.
- GDB is a free, source-available alternative for Linux, macOS, or Windows.
- OpenOCD is a free alternative for Windows, macOS, or Linux.
- Perl Debugger is a free alternative for Linux, macOS, or Windows.
- PonyDebugger is a free alternative for web, macOS, or iOS.
Verdict
Choose LLDB if you need a free C-family debugger with strong Xcode alignment, reusable APIs, and options to integrate it into editor or remote-debugging workflows. Its limits are clear: it cannot trace execution backward, some DAP requests are absent, and Windows ARM-family support remains experimental. Developers whose targets and workflow fit its established capabilities have a flexible debugger without a license cost; those needing the missing controls or more settled support on those Windows targets should consider another fit.
Verdict
LLDB combines debugger tools with APIs and editor integrations, and is the default debugger in Xcode on macOS. Check the platform-specific status, particularly for Windows and ARM-family support, before choosing it for those targets.
Questions
How much does LLDB cost?
LLDB is free. Its project code is available under the Apache 2.0 License with LLVM exceptions.
Which languages does LLDB debug?
It supports C, C++, Objective-C, and Objective-C++.
Which platforms does it support?
The listed target platforms are macOS, iOS, tvOS, watchOS, Linux, FreeBSD, NetBSD, Windows, and Android. Windows support is under active development, with ARM and AArch64 support described as more experimental.
Does LLDB support time-travel debugging?
No. Time-travel debugging is listed as unsupported.
Can LLDB connect to editors and IDEs?
Yes. lldb-dap provides an interface for compatible editors and IDEs, including Visual Studio Code, Emacs, vim, and neovim.
Where can I get lldb-dap?
The binary can come from a toolchain, an LLVM release package, or a system package manager. It can also be built from source.
Facts from LLDB's own pages
- Acquiring lldb-dap
- The lldb-dap binary can come from a toolchain, an LLVM release package or system package manager, or a source build. · lldb.llvm.org, 29 Sept 2026
- Additional uses
- The LLDB API can also be used for symbolication, disassembly, and object and symbol file introspection. · lldb.llvm.org, 29 Sept 2026
- API and scripting
- LLDB exposes a public C++ API through a shared library and Python script bindings, enabling scripting and uses such as symbolication and disassembly. · lldb.llvm.org, 30 Sept 2026
- Debug features
- lldb-dap documents support for function, conditional, data, and instruction breakpoints, memory read/write, and disassembly requests. · lldb.llvm.org, 29 Sept 2026
- Debugging tools
- LLDB supports breakpoints, watchpoints, process launching, and attaching to programs. · lldb.llvm.org, 30 Sept 2026
- Expression evaluation
- LLDB supports multiline expressions, can use a JIT when available, and can evaluate expression IR when the JIT cannot be used. · lldb.llvm.org, 30 Sept 2026
- Getting the debugger
- The lldb-dap binary can be obtained from an LLVM release package, a toolchain or package manager, or by building from source. · lldb.llvm.org, 30 Sept 2026
- IDE integration
- The lldb-dap component exposes LLDB through the Debug Adapter Protocol for editors and IDEs that support DAP, including Visual Studio Code, Emacs, Vim, and Neovim. · lldb.llvm.org, 30 Sept 2026
- Languages
- LLDB supports debugging C, Objective-C, and C++ on desktop and iOS devices and simulators. · lldb.llvm.org, 30 Sept 2026
- Language support
- LLDB supports debugging C, Objective-C, and C++ on desktop and iOS devices and simulators. · lldb.llvm.org, 29 Sept 2026
- License
- The LLDB project code is available under the Apache 2.0 License with LLVM exceptions. · lldb.llvm.org, 30 Sept 2026
- Notable limits
- lldb-dap documents no support for step-back, setting a variable, goto-target requests, or terminate requests. · lldb.llvm.org, 29 Sept 2026
- Other integration
- LLDB documentation describes an integration using the Model Context Protocol. · lldb.llvm.org, 30 Sept 2026
- Platforms
- The documentation lists macOS, iOS/tvOS/watchOS simulators and devices, Linux, FreeBSD, NetBSD, and Windows among platforms known to work. · lldb.llvm.org, 29 Sept 2026
- Platform support
- The project lists macOS, Linux, FreeBSD, NetBSD, and Windows support; it says Windows support is under active development and ARM and AArch64 support is more experimental. · lldb.llvm.org, 30 Sept 2026
- Purpose
- LLDB is a high-performance debugger built from reusable components that use LLVM libraries such as the Clang expression parser and LLVM disassembler. · lldb.llvm.org, 30 Sept 2026
- Remote debugging
- LLDB documents remote debugging for platforms including Linux, Windows, Android, and iOS. · lldb.llvm.org, 30 Sept 2026
- Reusable API
- LLDB exposes a public object-oriented C++ API through a shared library, with Python bindings also available. · lldb.llvm.org, 29 Sept 2026
- Security
- For security reasons, LLDB warns and does not source a current-directory .lldbinit file by default. · lldb.llvm.org, 30 Sept 2026
- Support and community
- The project directs LLDB discussions to its forum and the lldb channel on the LLVM Discord server. · lldb.llvm.org, 30 Sept 2026
- Windows status
- Windows support is under active development; basic functionality is expected to work, while ARM and AArch64 support is described as more experimental. · lldb.llvm.org, 29 Sept 2026
- Xcode
- LLDB is the default debugger in Xcode on macOS. · lldb.llvm.org, 29 Sept 2026
Where LLDB stands on Freedom251
- Debuggers#3 of 27
- Debugging Software#13 of 30