Freedom251 › Data Visualization Software

LabPlot
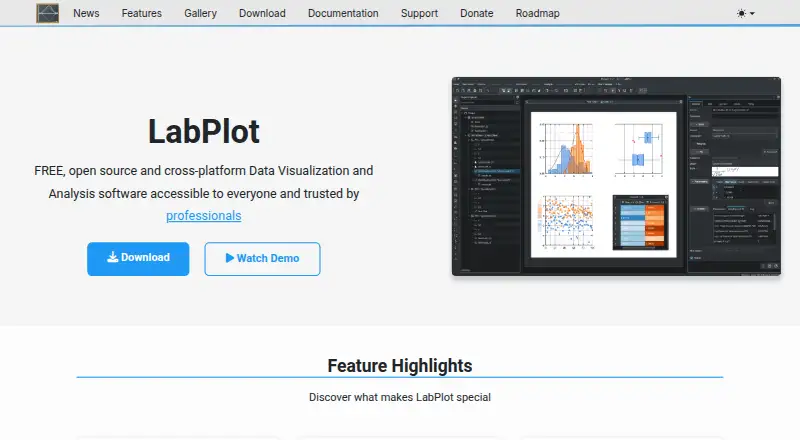
What LabPlot is
LabPlot is free, open-source desktop software for visualizing and analyzing data. It creates interactive 2D plots, including scatter, line, histogram, box, bar, KDE, and control charts, and offers tools for statistics, linear and nonlinear regression, curve fitting, smoothing, interpolation, Fourier transforms, and signal processing. Interactive computational notebooks support Python, R, Julia, Maxima, Octave, and Lua.
LabPlot imports many formats and sources, including CSV, Origin, SAS, Stata, SPSS, MATLAB, SQL, JSON, Excel, HDF5, MQTT, FITS, netCDF, and ROOT. It can read live data from Unix, UDP, and TCP sockets, as well as serial ports. Its plot digitizer extracts data from images through manual point selection or semi-automated curve extraction. The software is available for Linux, macOS, and Windows, with packages also listed for FreeBSD and Haiku distributions. The project says LabPlot runs locally and does not collect, transmit, or store user data. It sits under the KDE umbrella and is supported by KDE e.V., a registered nonprofit in Germany. The project describes its audience as including engineers, students, and research scientists across scientific fields.
Who it suits
LabPlot suits engineers, students, and research scientists who need local desktop tools for plotting and data analysis. Its notebooks, wide range of import formats, and live-data inputs can support varied scientific workflows.
What it does well
- Free and open-source desktop software.
- Creates interactive 2D plots, including control charts and KDE plots.
- Includes regression, curve fitting, Fourier transforms, and signal processing.
- Interactive notebooks support Python, R, Julia, Maxima, Octave, and Lua.
- Reads live data from sockets and serial ports.
- Runs locally and says it does not collect or transmit user data.
What to know first
- It is desktop software, rather than a web-based platform.
- No free trial is offered; the software is free instead.
- The listed main platforms are Linux, macOS, and Windows.
Plans
| Plan | Billed and limits | Price |
|---|---|---|
| LabPlot | Free desktop software · open source | Free |
As labplot.org lists them, read 11 Oct 2026. The maker's own page has the final word.
Getting started
- Visit the LabPlot website.
- Choose the package for Linux, macOS, or Windows.
- Install the desktop software and open a data source or file.
- Use the plot, analysis, notebook, or digitizer tools as needed.
Verdict
Choose LabPlot if you want free, open-source desktop software for scientific plotting and analysis, with notebook support and broad data import options. Look elsewhere if you need a web-based platform rather than a local desktop application.
Questions
How much does LabPlot cost?
LabPlot is free. Its listed plan is free.
Is LabPlot open source?
Yes. It is open-source software under the KDE umbrella, supported by KDE e.V., a registered nonprofit in Germany.
Which operating systems does LabPlot support?
The listed platforms are Linux, macOS, and Windows. The download page also lists FreeBSD and Haiku distributions.
Can LabPlot work with live data?
Yes. It can read live data through Unix, UDP, and TCP sockets and serial ports.
Does LabPlot store or transmit user data?
The project says LabPlot runs locally and does not collect, transmit, or store user data.
Facts from LabPlot's own pages
- Analysis
- Analysis tools include statistics, linear and nonlinear regression, curve fitting, smoothing, interpolation, Fourier transforms, and signal processing. · labplot.org, 11 Oct 2026
- Assessment
- The project offers a HECVAT v4.16 form and says cloud-infrastructure and SOC 2 questions may be not applicable to its local desktop software. · labplot.org, 11 Oct 2026
- Audience
- The project describes LabPlot as serving users across scientific fields, including engineers, students, and research scientists. · labplot.org, 11 Oct 2026
- Data formats
- It imports formats including CSV, Origin, SAS, Stata, SPSS, MATLAB, SQL, JSON, Excel, HDF5, MQTT, FITS, netCDF, and ROOT. · labplot.org, 11 Oct 2026
- Data sources
- CSV,Origin,SAS,Stata,SPSS,MATLAB,SQL,JSON,binary,ODS,Excel,HDF5,MQTT,BLF,FITS,netCDF,ROOT,LTspice,Ngspice,MCAP,Kaggle datasets,Unix/UDP/TCP sockets,serial ports · labplot.org, 20 Sept 2026
- Digitization
- The plot digitizer extracts data from images using manual point selection or semi-automated curve extraction. · labplot.org, 11 Oct 2026
- Downloads
- The download page lists packages for Windows, macOS, and Linux, as well as FreeBSD and Haiku distributions. · labplot.org, 11 Oct 2026
- Free plan
- Yes · labplot.org, 20 Sept 2026
- Live data
- It can read live data through Unix, UDP, and TCP sockets and a serial port. · labplot.org, 11 Oct 2026
- Notebooks
- Its interactive computational notebooks support languages and systems including Python, R, Julia, Maxima, Octave, and Lua. · labplot.org, 11 Oct 2026
- Organization
- LabPlot is an open-source project under the KDE umbrella, supported by KDE e.V., a registered nonprofit in Germany. · labplot.org, 11 Oct 2026
- Platform
- desktop · labplot.org, 20 Sept 2026
- Plots
- It supports interactive, publication-quality 2D plots, including scatter, line, histogram, box, bar, KDE, and control charts. · labplot.org, 11 Oct 2026
- Purpose
- LabPlot is free, open-source software for data visualization and analysis. · labplot.org, 11 Oct 2026
- Scheduled refresh
- Yes · labplot.org, 20 Sept 2026
- Security and privacy
- The project says LabPlot runs locally and does not collect, transmit, or store user data. · labplot.org, 11 Oct 2026
- Support
- Users can report bugs through KDE Bugtracking or the app, ask questions on KDE Discuss or Matrix, and contact the support team by email. · labplot.org, 11 Oct 2026
Where LabPlot stands on Freedom251
- Data Visualization Software#19 of 98