Freedom251 › Data Visualization Software

Bokeh
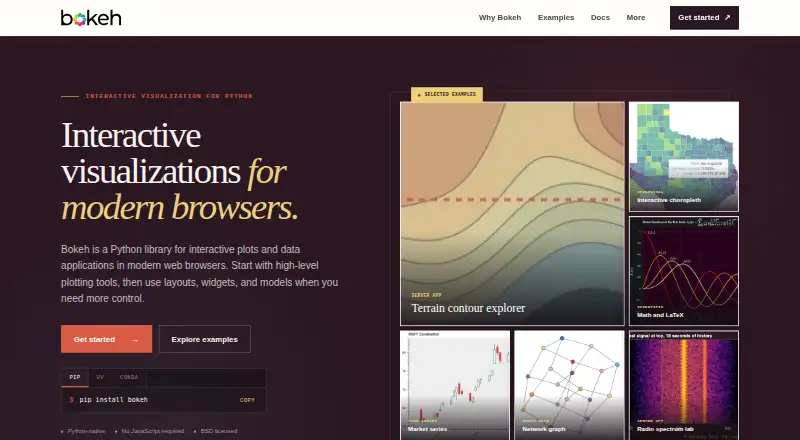
What Bokeh is
Bokeh is a free, BSD-licensed Python library for creating interactive plots and data applications in modern web browsers. Viewers can pan, zoom, hover, select, link, and filter plots, and work with editable data. Developers can use high-level plotting tools or lower-level layouts, widgets, annotations, models, themes, and extensions. Bokeh accepts Python lists, NumPy arrays, ColumnDataSource objects, pandas and Polars DataFrames, PyArrow DataFrames, pandas GroupBy objects, and REST endpoints as data sources. Data can be streamed or patched without replacing the full source, and supported glyphs can use WebGL acceleration.
Plots can be displayed in notebooks, saved as standalone HTML, embedded in web applications, or served with Bokeh server. The project describes using Bokeh in Jupyter and mounting it in FastAPI, Starlette, Django, or another ASGI application served with Uvicorn or Hypercorn. It is Python-native and supports JavaScript-powered visualizations without requiring users to write JavaScript themselves. Bokeh also lists interactive dashboards, scheduled refreshes, and embedded dashboards. The project is fiscally sponsored by NumFOCUS and maintained by contributors on GitHub. Support is volunteer-based, with usage questions directed to its public Discourse forum and bug reports or feature requests to GitHub.
Who it suits
Bokeh suits Python developers who need interactive browser plots or data applications and want to publish them in notebooks, HTML, or web apps. It also fits teams working with its listed Python data formats or REST endpoints.
What it does well
- Free, BSD-licensed Python library.
- Browser plots support pan, zoom, hover, selection, and filtering.
- Accepts a range of Python data structures and REST endpoints.
- Plots can be saved as standalone HTML or embedded in web apps.
- Data can be streamed or patched without replacing the full source.
What to know first
- Support is volunteer-based.
- Usage questions go to a public Discourse forum.
- The project directs bug reports and feature requests to GitHub.
Plans
| Plan | Billed and limits | Price |
|---|---|---|
| Bokeh | Open-source Python library · BSD licensed | Free |
As bokeh.org lists them, read 9 Oct 2026. The maker's own page has the final word.
Getting started
- Visit the Bokeh website.
- Install and use the Python library in your environment.
- Connect a supported data source, such as a DataFrame or REST endpoint.
- Build plots with its high-level plotting tools or lower-level components.
- Show plots in a notebook, save them as standalone HTML, embed them in a web app, or serve them with Bokeh server.
Verdict
Choose Bokeh if you want a free Python library for interactive browser plots, with several options for publishing and serving them. Its volunteer-based support model may be a consideration for teams that need a different support arrangement.
Questions
Is Bokeh free?
Yes. Bokeh has a free plan priced at $0, and the project describes it as BSD licensed.
Which platforms does Bokeh support?
The listed platforms are Linux, macOS, web, and Windows. Its plots are designed for modern web browsers.
What data sources can it use?
Listed sources include Python lists, NumPy arrays, ColumnDataSource, pandas and Polars DataFrames, PyArrow DataFrames, pandas GroupBy objects, and REST endpoints.
Can Bokeh plots be embedded or refreshed?
Yes. Embedded dashboards and scheduled refresh are listed. Plots can also be embedded in a web app, and data can be streamed or patched.
Is Bokeh open source?
The project describes Bokeh as BSD licensed and lists its plan as an open-source Python library.
Where can users get support?
Support is volunteer-based. The project directs usage questions to its public Discourse forum and bug reports or feature requests to its GitHub issue tracker.
Facts from Bokeh's own pages
- APIs
- Bokeh offers high-level plotting tools and lower-level layouts, widgets, annotations, models, themes, and extensions. · bokeh.org, 9 Oct 2026
- Browser interaction
- Plots include tools for pan, zoom, hover, selection, linking, filtering, and editable data. · bokeh.org, 9 Oct 2026
- Bug reports
- The project directs bug reports and feature requests to its GitHub issue tracker. · bokeh.org, 9 Oct 2026
- Dashboard type
- interactive · bokeh.org, 20 Sept 2026
- Data handling
- Users can stream or patch data without replacing the full data source, and supported glyphs can use WebGL acceleration. · bokeh.org, 9 Oct 2026
- Data sources
- Python lists,NumPy arrays,ColumnDataSource,pandas DataFrames,Polars DataFrames,PyArrow DataFrames,pandas GroupBy objects,REST endpoints · bokeh.org, 20 Sept 2026
- Embedded dashboards
- Yes · bokeh.org, 20 Sept 2026
- Free plan
- Yes · bokeh.org, 20 Sept 2026
- Integrations
- The site describes using Bokeh in Jupyter and mounting it in FastAPI, Starlette, Django, or another ASGI app served with Uvicorn or Hypercorn. · bokeh.org, 9 Oct 2026
- License
- The project describes Bokeh as BSD licensed. · bokeh.org, 9 Oct 2026
- No JavaScript required
- The site describes Bokeh as Python-native and says users can build JavaScript-powered visualizations without writing JavaScript themselves. · bokeh.org, 9 Oct 2026
- Platform
- web_and_desktop · bokeh.org, 20 Sept 2026
- Project stewardship
- Bokeh is a fiscally sponsored NumFOCUS project built and maintained by contributors on GitHub. · bokeh.org, 9 Oct 2026
- Publishing
- Plots can be shown in notebooks, saved as standalone HTML, embedded in a web app, or served with Bokeh server. · bokeh.org, 9 Oct 2026
- Scheduled refresh
- Yes · bokeh.org, 20 Sept 2026
- Security and compliance
- The official pages opened describe the BSD license and Code of Conduct but make no security or compliance certification claim. · bokeh.org, 9 Oct 2026
- Support
- Support is volunteer-based, and the project directs usage questions to its public Discourse forum. · bokeh.org, 9 Oct 2026
- What it does
- Bokeh is a Python library for interactive plots and data applications in modern web browsers. · bokeh.org, 9 Oct 2026
Where Bokeh stands on Freedom251
- Data Visualization Software#10 of 98
- Data Visualization Libraries Software#3 of 23