Freedom251 › Profiling Software
async-profiler
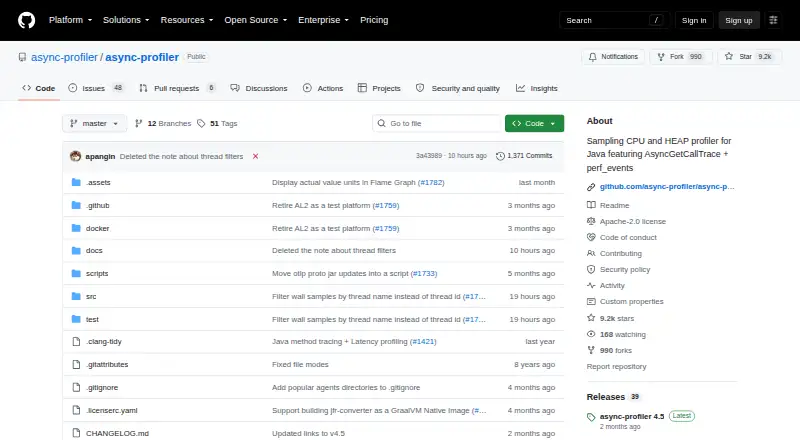
What async-profiler is
async-profiler is a free sampling profiler for Java that aims to keep overhead low while avoiding safepoint bias. It works with OpenJDK and other runtimes based on the HotSpot JVM, and its stack traces can include non-Java threads plus native and kernel frames. Profiling targets include CPU time, Java-heap and native-memory allocations, memory leaks, contended locks, and hardware or software performance counters. Documented modes include CPU, allocation, wall-clock, Java-method, and multiple-events profiling. Results can be exported as collapsed stacks, flame graphs, HTML tree views, or text; interactive Flame Graph output can be viewed in a browser. Maintained builds are provided for Linux and macOS on x64 and arm64. A Java API is available as a Maven dependency, and IntelliJ IDEA bundles the profiler in its Java Profiler settings. It can profile Java processes in Docker or LXC containers from inside the container or from the host system. Building requires make, GCC 7.5.0 or newer or Clang 7.0.0 or newer, static libstdc++, and JDK 11 or newer.
Who it suits
It suits Java developers who need to profile CPU, memory, locks, or performance counters, including Java processes in Docker or LXC. Developers can use the Java API or IntelliJ IDEA integration as well as the command-line profiler.
What it does well
- Targets CPU, heap, native memory, locks, and counters.
- Includes native and kernel frames in stack traces.
- Exports flame graphs, HTML tree views, and text.
- Official builds cover Linux and macOS x64 and arm64.
- Can profile Docker or LXC processes from host or container.
What to know first
- Building requires make, a supported compiler, static libstdc++, and JDK 11+.
- Official maintained builds are listed for Linux and macOS only.
- Nightly binaries for previous commits are retained for 30 days.
Plans
| Plan | Billed and limits | Price |
|---|---|---|
| Community open-source | No charge · Apache License 2.0 · Linux and macOS binaries | Free |
As github.com lists them, read 1 Oct 2026. The maker's own page has the final word.
Getting started
- Visit the async-profiler project website on GitHub.
- Choose an official build for Linux or macOS on x64 or arm64.
- Run it against an OpenJDK or other HotSpot-based Java runtime.
- Add the Java API as a Maven dependency if you want to use it from Java.
- Open saved Flame Graph results in a browser, or use another supported output format.
Verdict
async-profiler covers several Java performance targets and provides multiple ways to inspect results. Check its build requirements if you plan to build it yourself rather than use an official build.
Questions
Does async-profiler cost anything?
The community open-source plan costs nothing and is licensed under Apache License 2.0.
Which Java runtimes does it support?
It works with OpenJDK and other Java runtimes based on the HotSpot JVM.
Which platforms have official builds?
Officially maintained builds are provided for Linux and macOS, for x64 and arm64.
What can it profile?
Targets include CPU time, Java-heap and native-memory allocations and leaks, contended locks, and hardware or software performance counters.
What output formats are available?
It supports collapsed stacks, flame graphs, HTML tree views, and text. Interactive Flame Graph results can be viewed in a browser.
What is needed to build it?
Building requires make, GCC 7.5.0 or later or Clang 7.0.0 or later, static libstdc++, and JDK 11 or later.
Facts from async-profiler's own pages
- Build requirements
- Building requires make, GCC 7.5.0+ or Clang 7.0.0+, static libstdc++, and JDK 11+. · github.com, 1 Oct 2026
- Container profiling
- It can profile Java processes in Docker or LXC containers from inside the container or from the host system. · github.com, 1 Oct 2026
- IDE integration
- IntelliJ IDEA bundles async-profiler and exposes it through the Java Profiler settings. · github.com, 1 Oct 2026
- Java integration
- A Java API is published to Maven Central and can be used as a Maven dependency. · github.com, 1 Oct 2026
- Native visibility
- It monitors non-Java threads and shows native and kernel frames in stack traces. · github.com, 1 Oct 2026
- Nightly retention
- Nightly binaries for previous commits are kept for 30 days. · github.com, 1 Oct 2026
- Official builds
- Officially maintained builds are provided for Linux x64 and arm64 and macOS x64 and arm64. · github.com, 1 Oct 2026
- Output
- The profiler can save results as an interactive Flame Graph viewable in a browser. · github.com, 1 Oct 2026
- Output formats
- Supported output formats include collapsed stacks, flame graphs, HTML tree views, and text. · github.com, 1 Oct 2026
- Profiling modes
- The documentation lists CPU, allocation, wall-clock, Java-method, and multiple-events profiling modes. · github.com, 1 Oct 2026
- Profiling targets
- It can profile CPU time, Java-heap allocations, native-memory allocations and leaks, contended locks, and hardware or software performance counters. · github.com, 1 Oct 2026
- Purpose
- async-profiler is a low-overhead sampling profiler for Java that avoids the safepoint bias problem. · github.com, 1 Oct 2026
- Runtime support
- It works with OpenJDK and other Java runtimes based on the HotSpot JVM. · github.com, 1 Oct 2026
- Security reporting
- Security issues should be reported to AWS/Amazon Security through its vulnerability reporting page instead of a public GitHub issue. · github.com, 1 Oct 2026
- Span API
- The Span API records latency-sensitive intervals into the same JFR recording as profiling samples and is allocation-free. · github.com, 1 Oct 2026
Where async-profiler stands on Freedom251
- Profiling Software#3 of 29