Freedom251 › Profiling Software

Amazon CodeGuru Profiler
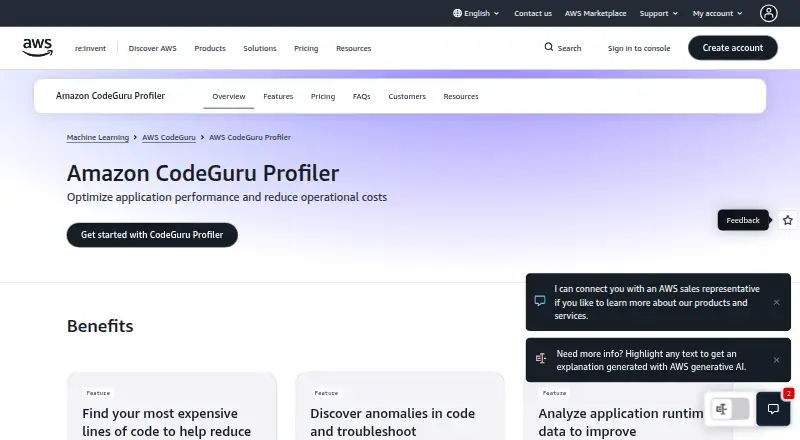
What Amazon CodeGuru Profiler is
Amazon CodeGuru Profiler collects runtime performance data from live applications so teams can investigate resource use and performance bottlenecks. It is designed to profile production applications continuously with minimal overhead. Interactive flame graphs display CPU and latency analysis, highlighting the code paths that use the most resources. Machine learning recommendations identify expensive methods and describe their cause, impact, and possible resolution. The service can also detect anomalies in application profiles and, when configured, send an Amazon SNS notification about a new anomaly.
CodeGuru Profiler supports Java and other JVM languages, including Scala and Kotlin, as well as Python 3.6 or later. Java and other JVM languages can be profiled for CPU and heap summary; Python profiling covers CPU wall-clock time. Applications can run on EC2, ECS, EKS, Fargate, Lambda, or on premises. The profiling agent can be enabled in JVM applications from the command line or application code, and can also profile Lambda applications. It collects stack traces, but does not access function parameters, variable values, or application data. Data is encrypted at rest and in transit. Using the service requires an AWS account, with IAM permissions controlling access to its resources. A 90-day free tier is available; after it ends, standard sampling-hour pricing applies.
Who it suits
It suits teams running Java, other JVM, or Python applications that want ongoing production profiling, flame graph analysis, or recommendations for expensive methods. It is also relevant for teams that need profile anomaly notifications or profiling across the listed AWS compute environments and on-premises applications.
What it does well
- Profiles production applications continuously with minimal overhead.
- Interactive flame graphs show CPU and latency by code path.
- Recommendations explain expensive methods and their possible resolution.
- Can notify through Amazon SNS when it detects an anomaly.
- Stack traces are collected without application data or variable values.
What to know first
- Requires an AWS account and IAM access permissions.
- The free tier lasts 90 days before sampling-hour pricing applies.
- Python profiling covers CPU wall-clock time.
Limits
The Amazon CodeGuru Profiler Free Tier is free for 90 days; standard sampling-hour pricing applies afterward. Python profiling covers CPU wall-clock time, while Java and other JVM languages can be profiled for CPU and heap summary.
Plans
| Plan | Billed and limits | Price |
|---|---|---|
| Amazon CodeGuru Profiler Free Tier | 90 days; after that, standard sampling-hour pricing applies | Free |
| Amazon CodeGuru Profiler on AWS Lambda | First 500 sampling hours per payer account are free; then $0.005 per sampling hour up to 36,000 sampling hours per profiling group per month · First 500 sampling hours per payer account free · no additional charge beyond 36,000 hours per profiling group per month | $0.01 a month |
| Amazon CodeGuru Profiler on EC2, ECS, EKS, and AWS Fargate | Per sampling hour; no additional charge beyond 36,000 sampling hours per profiling group per month · $0.005 per sampling hour for the first 36,000 sampling hours per profiling group per month · no additional charge beyond 36,000 hours | $0.01 a month |
As aws.amazon.com lists them, read 8 Oct 2026. The maker's own page has the final word.
Getting started
- Open the CodeGuru Profiler website.
- Create or use an AWS account and configure IAM permissions for access.
- For a JVM application, enable the profiling agent from the command line or application code.
- For Lambda applications, use the profiling agent to profile the application.
- Start with the 90-day free tier, then use the applicable sampling-hour pricing.
Verdict
Choose Amazon CodeGuru Profiler for supported Java, JVM, or Python applications when continuous profiling, flame graphs, and method recommendations fit the work. It also provides anomaly detection and optional Amazon SNS notifications. Look elsewhere if the application language or Python profiling scope does not fit, or if an AWS account is not suitable.
Questions
Is Amazon CodeGuru Profiler free?
Its free tier costs nothing for 90 days. Standard sampling-hour pricing applies after that.
What does it cost after the free tier?
The listed EC2, ECS, EKS, and Fargate plan is $0.01 a month, billed per sampling hour; the first 36,000 sampling hours per profiling group per month cost $0.005 per sampling hour, with no additional charge beyond 36,000 hours. The Lambda plan is $0.01 a month; the first 500 sampling hours per payer account are free, followed by $0.005 per sampling hour up to 36,000 sampling hours per profiling group per month.
Which languages does it support?
It supports Java and other JVM languages, as well as Python 3.6 or later. Java and JVM profiling covers CPU and heap summary; Python profiling covers CPU wall-clock time.
Where can profiled applications run?
The listed environments are EC2, ECS, EKS, Fargate, Lambda, and on premises.
What data does the agent collect?
It collects stack traces. It does not access function parameter names or values, variable values, or application data.
How is access controlled?
An AWS account is required, and IAM permissions control who can create or access CodeGuru Profiler resources.
Facts from Amazon CodeGuru Profiler's own pages
- Anomaly detection
- It detects anomalies in application profiles and can send an Amazon SNS notification when a new anomaly is detected if configured. · aws.amazon.com, 8 Oct 2026
- Compliance
- AWS says third-party auditors assess CodeGuru Profiler as part of multiple compliance programs, including SOC, PCI, FedRAMP, and HIPAA. · docs.aws.amazon.com, 8 Oct 2026
- Data collected
- The agent collects stack traces but does not access function parameter names or values, variable values, or application data. · docs.aws.amazon.com, 8 Oct 2026
- Data retention
- The service retains five-minute profiles for 15 days, hourly profiles for 60 days, and daily profiles for three years. · docs.aws.amazon.com, 8 Oct 2026
- Encryption
- Data at rest and in transit are encrypted by default; traffic to the service and downstream dependencies uses TLS. · docs.aws.amazon.com, 8 Oct 2026
- Flame graphs
- It presents CPU and latency analysis in interactive flame graphs to show which code paths consume the most resources. · aws.amazon.com, 8 Oct 2026
- Integration
- The profiling agent can be enabled in JVM applications from the command line or application code and is also used to profile Lambda applications. · docs.aws.amazon.com, 8 Oct 2026
- Language capability limit
- The FAQ says Java and other JVM languages can be profiled for CPU and heap summary, while Python profiling covers CPU wall-clock time. · aws.amazon.com, 8 Oct 2026
- Production profiling
- The profiler is designed to run continuously on production applications with minimal overhead. · aws.amazon.com, 8 Oct 2026
- Purpose
- Amazon CodeGuru Profiler collects runtime performance data from live applications and provides recommendations to improve performance and find CPU bottlenecks. · aws.amazon.com, 8 Oct 2026
- Recommendations
- Machine learning recommendations identify expensive or resource-intensive methods and explain the cause, impact, and possible resolution. · aws.amazon.com, 8 Oct 2026
- Runtime support
- The FAQ lists Java, Python, and JVM languages such as Scala and Kotlin, and says applications can run on EC2, ECS, EKS, Fargate, Lambda, or on premises. · aws.amazon.com, 8 Oct 2026
- Support and permissions
- Using the service requires an AWS account, and IAM permissions control who can create or access CodeGuru Profiler resources. · docs.aws.amazon.com, 8 Oct 2026
Where Amazon CodeGuru Profiler stands on Freedom251
- Profiling Software#1 of 29
- Continuous Profiling Tools#3 of 30