A dashboard value can differ from what you just saw at a sensor without either being wrong: they may represent different times, units, intervals, or stages of processing. To find out, trace one recent reading from the device to the platform record and then to the dashboard, checking that each step refers to the same sensor and observation.
Run a three-point check on one reading
Pick one sensor and one recent observation. Compare the device’s raw output, the platform’s received or stored record, and the corresponding dashboard point. The aim is not to assume every system exposes the same fields; it is to identify where the value or its meaning changes.
As an Amazon Associate I earn from qualifying purchases.
- At the device: Record the sensor or property, raw value, unit, and observation timestamp. If the device does not expose a raw reading, use the nearest available source before platform processing.
- In the platform: Find the record for that same sensor and property. Note its value and unit, and distinguish the observation or event time from any receipt, processing, or storage time shown.
- On the dashboard: Locate the point for the same sensor and observation. Check the selected time range, time zone, displayed unit, and whether the point is a raw reading, aggregate, filtered value, or derived result.
- Compare like with like: Align the timestamp or interval, time zone, unit, aggregation, and sensor. If the platform shows both event time and arrival or storage time, compare them; the gap can reveal delay.
EPA guidance on matching datasets emphasizes checking timestamps and time zones, while SAP documents monitoring ingestion delay by comparing when data was observed with when it arrived. Together, those checks provide a practical way to locate a mismatch without assuming a particular platform’s fields or workflow (EPA quality assurance guidance; SAP time-series ingestion monitoring).
What’s actually slowing this PC down?
Pick the symptom - the matching free tool is one click away.
Check time and delivery before blaming accuracy
Time zone, interval, and device clock
A value may look stale or shifted if the dashboard uses a different time zone or interval from the device record. First confirm what the timestamp means: the time of measurement, the time the platform received it, or another processing time. Also check the dashboard’s selected range and whether it groups readings into intervals.
#1 Best Overall

- BUILD YOUR NEXT PROJECT: Bring your ideas to life with a compact touchscreen for Raspberry Pi projects, smart home dashboards, robotics, DIY electronics and embedded systems. Connect through HDMI and start building
- CLEAR IPS DISPLAY: See code, dashboards and system data clearly on the 1024×600 IPS display, with 420 nits of brightness, 60Hz refresh and a 170° viewing angle for a comfortable view
- TAP, SWIPE AND TAKE CONTROL: Tap, swipe and navigate naturally with 5-point capacitive touch. No extra touch driver is needed, making it easy to interact with supported apps on Pi OS, Linux, Ubuntu, Debian, Android and Windows. Note: Touch functionality is not supported on iOS
- CONNECT YOUR PI 5 OR 4: Connecting your Raspberry Pi 5 or 4 is simple: use the included Micro-HDMI to HDMI adapter, then connect the display to your board through HDMI. No need to buy the adapter separately
- TURN YOUR PC INTO A SENSOR PANEL: Keep an eye on CPU temperature, GPU usage, memory and other live system data with a compact PC sensor panel. It’s a practical addition to custom PC cases and hardware monitoring setups
Clock drift can make a correctly transmitted reading appear to belong to the wrong time. Microsoft Defender for IoT describes time drift as a lack of UTC synchronization and advises configuring an NTP server in that product context. That is a product-specific troubleshooting recommendation, not a guarantee that every sensor or platform uses the same clock setup (Microsoft Defender for IoT sensor troubleshooting).
Delay between observation and arrival
The time a sensor observes something and the time the platform receives or stores its record are distinct. A large gap points toward a delivery or ingestion delay rather than a dashboard calculation. SAP lists poor connectivity, sensor malfunction, and device transmission problems among possible causes of delayed ingestion (SAP delayed data ingestion documentation, version 2109b).
Rank #2
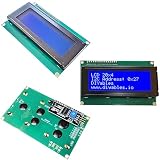
- LCD 20x4 I2C 3-Pack: Three 20x4 character displays with blue backlight and I2C interface, compatible with Arduino Mega, Uno, ESP32, ESP8266, and Raspberry Pi.
- Blue Backlight Clarity: Bright blue background with white text, ideal for Arduino Uno and Raspberry Pi sensor data or menu displays.
- Easy I2C Connection: Uses only two data pins (SDA, SCL) plus power, simplifying wiring for ESP32 and ESP8266 IoT projects.
- Adjustable 20x4 Display: High-contrast screen with adjustable brightness, perfect for Arduino Mega clocks, counters, or dashboards.
- DIY Project Bundle: Three I2C LCDs for multiple builds, great for prototyping monitors or robotics with ESP8266 and Raspberry Pi.
Check ordering, schema, and transformations
Out-of-order arrivals and recalculated history
Some systems receive readings out of order. SAP documents that out-of-order readings can lead to affected derived values being recomputed, so a historical dashboard point may change after later processing. A repeated-looking timestamp or a value that changes in the past is therefore not, by itself, proof that the sensor changed its original reading. Processing behavior and configuration vary by product and version (SAP out-of-order data documentation, version 2211).
The Tool Desk
Outbyte PC Repair FREEClear out junk files and repair common Windows errorsFree Scan →Outbyte Driver Updater FREEFix the driver behind crashes, sound loss and screen glitchesFind Drivers →Payload and schema validation
A sensor can produce a plausible value that the platform does not parse or store as intended. Check whether the payload conforms to the device or property schema, including valid JSON where applicable. Azure IoT Central identifies invalid JSON and a mismatch between a device and its template as reasons data may not appear, and documents validation commands for telemetry and property updates. Other platforms have their own validation tools (Azure IoT Central troubleshooting).
Rank #3

- ST7789 2.8 INCH TFT DISPLAY: Full-color 2.8 inch TFT LCD with ST7789 driver IC delivering 240x320 resolution and vivid 16-bit 65536-color output for visual interfaces in embedded projects
- TOUCHSCREEN INPUT: Built-in touch panel enables interactive user input directly on the display surface for menu navigation buttons and control in Arduino and ESP32 applications
- SPI INTERFACE: High-speed SPI communication reduces wiring complexity and delivers fast display refresh rates for smooth graphics rendering on all supported microcontroller platforms
- LIBRARY AND TUTORIAL PROVIDED: Comes with library support and step-by-step tutorials for Arduino, ESP32, and ESP8266 enabling quick setup without extensive configuration
- WIDE PLATFORM COMPATIBILITY: Compatible with Arduino, ESP32, ESP8266, and Raspberry Pi for IoT dashboards, HMI panels, sensor displays, data visualizers, and DIY project interfaces
Raw readings versus processed values
AIoT systems can distribute work across a device, edge, and cloud. Local preprocessing or cloud processing may filter, aggregate, or derive values, so the dashboard may not show the sensor’s raw observation. ITU-T Recommendation Y.4618 describes this distributed device-edge-cloud model; use it as a reminder to identify which stage’s output the dashboard displays, not as evidence of a specific transformation in your setup (ITU-T Y.4618, approved June 29, 2026).
Independent reader supportYour contribution helps us test, update, and keep practical guides available for everyone.Check the sensor and the wider data path
Look for quality patterns
Once time, delivery, schema, and processing align, assess whether the data itself looks credible. Look for gaps, outliers, drift, readings that remain stuck, values outside the expected range, and implausible rates of change. Judge these against the device or application requirements and a measured baseline; there is no universal acceptable error or delay for every AIoT system.
Rank #4
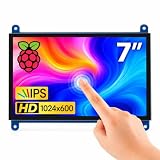
- 7-INCH TOUCH SCREEN FOR RASPBERRY PI – Build DIY dashboards, IoT controls, robotics, and portable terminals with ease.
- 1024X600 IPS LCD DISPLAY – See clear menus, sensor data, and server status from wide angles on a compact 7-inch screen.
- SMALL HDMI MONITOR – Get smooth visuals while keeping the 40-pin GPIO free for sensors, fans, and project add-ons.
- INTUITIVE TOUCHSCREEN MONITOR – Navigate menus and adjust settings directly, reducing reliance on a separate mouse.
- RELIABLE SETUP – Use the correct HDMI and USB touch connections with stable power for confident display and control.
For air sensors, the EPA recommends combining automated checks with manual review because automatic rules can miss subtle problems or flag a real event. A separate, suitable reference measurement can help assess a sensor, but the appropriate check depends on what the sensor measures and the application (EPA quality assurance for air sensors).
PC Slower Than It Used to Be?
A free scan shows the junk files, broken settings and background clutter dragging Windows down - then fixes them in one click.Free scan · Windows 10 & 11Crashes, No Sound, or Screen Glitches?
Random freezes, missing sound and display glitches usually trace back to one bad driver. Find and replace yours safely.Free scan · under a minuteFollow service health across components
If the mismatch affects multiple sensors or records, inspect the path beyond the dashboard: device connectivity, gateways or edge components, ingestion, storage, and visualization. AWS recommends monitoring across the IoT solution and retaining historical monitoring data so current performance can be compared with baselines (AWS IoT Core monitoring).
Best Value
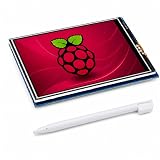
- 3.5 INCH SCREEN FOR RASPBERRY PI – Build a compact system monitor, DIY dashboard, or touch control for portable projects.
- 480X320 TFT LCD DISPLAY – View clear color graphics, sensor data, server status, custom GUIs, IoT, and embedded projects.
- RESISTIVE TOUCH SCREEN FOR RASPBERRY PI – Get precise single-touch control with a stylus for menus, robotics, and automation.
- SPI GPIO DISPLAY – Mounts to the 40-pin header for a clean build; check board, fan, and case clearance before assembly.
- GUIDED SETUP & COMPATIBILITY – Verify model and OS support; follow driver, rotation, calibration, and white-screen steps.
Use the mismatch to narrow the fault
After comparing the three points, focus on the first place where the record changes or disappears. This is a diagnostic inference, not a substitute for the platform’s own logs or device documentation.
Quick Recap
- Device and platform agree; dashboard differs: Recheck dashboard time range, time zone, unit, aggregation, filters, and whether it displays a processed value.
- Device has a reading; platform record is missing or late: Investigate connectivity, transmission, schema validation, and ingestion timing.
- Platform record is timely but the value differs from the device: Check unit conversion, payload interpretation, preprocessing, and whether you matched the same property.
- Past dashboard values change: Check for out-of-order arrivals and recalculation of derived values.
- Many devices or properties show trouble at once: Examine shared connectivity and service components and compare monitoring history with normal behavior.
- All timestamps and processing steps match, but readings look implausible: Investigate sensor quality, expected operating range, and an independent reference appropriate to the measurement.
Product prices and availability are accurate as of the date/time indicated and are subject to change. Any price and availability information displayed on Amazon at the time of purchase will apply.

