Windows Errors? Fix Them Before They Spread
Repair common Windows errors and clear accumulated junk for a smoother, more stable PC - no reinstall needed.Free scan · no reinstallOutdated Drivers Are Slowing You Down
One free scan finds every outdated or missing driver and matches the right update for your exact hardware.Free scan · exact hardware match“200 GW” is JLL’s forecast for global data center capacity by 2030—not a reading of current electricity use, annual energy consumption, or a single power demand that every grid must supply at once. JLL’s 2026 outlook puts capacity at 103 GW in 2025 and projects it to reach 200 GW by 2030, with AI potentially accounting for half of that capacity. The forecast captures the scale of the challenge: computing can be deployed quickly, but the grid, generation and contracts needed to serve it take longer to plan and build.
What does the 200 GW forecast actually measure?
JLL’s 2026 outlook estimates that global data center capacity will grow from 103 GW in 2025 to 200 GW by 2030—an addition of roughly 97 GW over that period. It is a forecast, not a settled outcome. JLL says AI could account for half of data center capacity by 2030, but that does not mean AI will use half of all electricity worldwide.
As an Amazon Associate I earn from qualifying purchases.
GW measures power capacity, or the rate at which electricity can be supplied or used. GWh and TWh measure energy delivered over time. The 200 GW figure is about data center capacity; it is not a forecast of annual electricity consumption. Actual energy use depends on how much equipment is running, how intensively it is used, and the facilities’ operating patterns.
Free tools Windows power users keep installed
One-click scans. No signup required.
The broader electricity system is growing too. The International Energy Agency’s 2026 outlook projects average annual global electricity-demand growth of 3.6% from 2026 through 2030, driven by several factors, including industry, electric vehicles, air conditioning and data centers. The IEA also reports that worldwide demand grew 3% year on year in 2025. Data centers are part of a wider load increase, not the only new claim on electricity.
#1 Best Overall
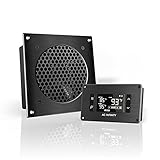
- An ultra quiet UL-certified fan system designed for cooling cabinets that requires minimal noise.
- Features an on board processor that provides a digital read-out of the cabinets temperatures.
- Programming includes thermostat control, fan speed control, and SMART energy saving mode.
- Dimensions: 6.3 x 6.3 x 1.3 in. | Airflow: 52 CFM | Noise: 18 dBA | Bearings: Dual Ball
Why does AI make the grid challenge more acute?
AI changes not only how many data centers are planned, but also how much computing equipment may be concentrated in a facility. Data Center Knowledge reported conference estimates in 2026 that typical rack densities were moving from roughly 10–30 kW toward 80–150 kW, with advanced deployments approaching 1 MW per rack. These are industry-reported ranges, not a metered survey of every deployment.
At still higher levels, Switch vice president Alise Porto described a modular “AI factory” design target of up to 2 MW per rack. That is a company design target, not an industry average. Higher density can intensify the need to coordinate power delivery and facility design, but the figures alone do not establish how much a particular site will consume or what its connection will require.
Rank #2
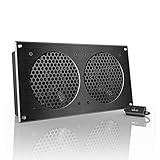
- An ultra-quiet UL-certified fan system designed for cooling cabinets that requires minimal noise.
- Features a multi-speed controller to set the fan’s speed to optimal noise and airflow levels.
- Contains a CNC machined aluminum frame with a modern brushed black finish.
- Powered by wall outlet or USB port, included Turbo Adapter increases performance by 25%.
- Dimensions: 11.69 x 6.3 x 1.3 in. | Total Airflow: 104 CFM | Total Noise: 19 dBA | Bearings: Dual Ball
“Everything now revolves around power.” — Alise Porto, vice president of sustainability and strategic initiatives at Switch, as quoted by Data Center Knowledge on September 29, 2026.
Recommended Free Tools
The scale of proposed campuses is changing as well. Scott Hart, executive vice president of NRG Business, described the shift this way: “Traditionally, data centers would be a grid-connected, 20- to 40-MW facility,” followed by: “Then we saw the cloud campuses in the 100 MW range, but now conversations have pivoted to a gigawatt and beyond.” These are Hart’s observations about the projects being discussed, not a universal description of data center construction.
Rank #3
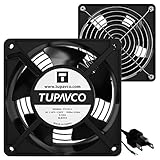
- Pair of axial fans made to keep air flow and your equipment at low temperature
- Fits all standard 19” network cabinets; AC 110V Fan; 95/110CFM Airflow; 2600-2800rpm; 45dBA, Silent; AC cable 6.2ft and Ground wire 9" attached
- Network Cabinet Fan Applications - fan cooler panels, trays or server, media cabinets, computer case, DIY mount; overheat protection
- Steel Frame; Metal Finger Guard; Quick Mount Silicone Rubber Screws - Rivets; Self-tapping screws;
- Standard accessories exhaust replacement size: outer dimensions: 4.75”x4.75" - 4 inch between holes
Why can’t power infrastructure keep pace with computing plans?
The mismatch is partly about different planning clocks. Data Center Knowledge quoted Hart saying data center technology timelines can run in months or a few years, while power infrastructure can involve decisions and investments that play out over decades. In the example he described, a utility needed at least a 15-year horizon and secured offtake—a commitment to buy the power—to justify investment. That is a condition Hart cited for that example, not a universal rule for every utility or project.
That long-term investment horizon is distinct from the time it takes a specific project to connect. JLL’s 2026 outlook reports that average grid connection lead times exceed four years in primary markets. It is a market-level average, not a timetable that applies to every site. Local network capacity, project requirements, utility processes and the work needed to connect can all affect a project’s path.
Rank #4

- An ultra-quiet UL-certified blower system designed for cooling cabinets that requires minimal noise.
- Low-profile aluminium frame is ideal where mounting space is limited or a smaller footprint is desired.
- Features a multi-speed controller to set the fan’s speed to optimal noise and airflow levels.
- Powered by wall outlet or USB port, included Turbo Adapter increases performance by 25%.
- Dimensions: 5.8 x 2.0 x 4.7 in | Airflow: 35 CFM | Noise: 17 dBA | Bearings: Dual Ball
Connection queues show the scale of competing requests, but they need careful interpretation. The IEA reported in 2026 that more than 2,500 GW of projects were stalled in grid connection queues worldwide. That queue includes renewables, storage and large loads such as data centers; it is not 2,500 GW of data center demand, nor does it mean every queued project will be built.
The Tool Desk
Outbyte PC Repair FREEClear out junk files and repair common Windows errorsFree Scan →Outbyte Driver Updater FREEFix the driver behind crashes, sound loss and screen glitchesFind Drivers →How can data centers get power while the grid catches up?
There is no universally best supply strategy in the available evidence. The right mix depends on local grid conditions, the site, permitting, operating needs and the terms of power and connection agreements. These approaches address different parts of the problem and may be combined.
Best Value

- An ultra-quiet UL-certified fan system designed for cooling cabinets that requires minimal noise.
- Features a multi-speed controller to set the fan’s speed to optimal noise and airflow levels.
- Contains a CNC machined aluminum frame with a modern brushed black finish.
- Powered by wall outlet or USB port, included Turbo Adapter increases performance by 25%.
- Dimensions: 8.5 x 4.4 x 1.3 in. | Total Airflow: 52 CFM | Total Noise: 18 dBa | Bearings: Dual Ball
| Approach | What it can address | Questions to evaluate |
|---|---|---|
| Grid-only supply with earlier utility planning | Connection planning and utility capacity needs. | What is the local hosting capacity? What is the likely connection timeline? What queue position and contract horizon are available? |
| Grid supply plus on-site generation | Supply diversity and, depending on the project, some timing or capacity needs. | Can the site obtain permits and fuel or another energy resource? What are the emissions and reliability implications? What offtake commitment supports investment? |
| Battery storage and demand response | Short-duration flexibility, peak management and potential grid support. | How long can storage discharge? Who controls dispatch? What do local grid rules allow, and what role can storage play during an outage? |
| Non-firm connection agreements | Potentially earlier grid access in exchange for operating limits. | When can the site be curtailed, under what terms, and can its critical operations tolerate those limits? |
| Grid-enhancing technology and network upgrades | Making more use of existing network capacity or expanding transfer capacity. | What constraint is present at this site? What is the cost and implementation time? Does the system operator approve the proposed work? |
These options are not interchangeable. On-site generation does not automatically eliminate the need for a grid connection; a battery’s usefulness depends on its duration and dispatch rules; and a non-firm connection can mean accepting curtailment. The source evidence does not provide comparable project cost, reliability or emissions results, so it cannot support a numerical ranking of these choices.
Independent reader supportYour contribution helps us test, update, and keep practical guides available for everyone.Could flexible connections and grid upgrades unlock capacity sooner?
Potentially, but the estimates are not a promise of power for a particular campus. In 2026, the IEA estimated that 1,200–1,600 GW of advanced-stage queued projects could potentially be enabled through measures including non-firm connections and technology upgrades. Its breakdown is 750–900 GW associated with more flexible non-firm connection agreements and 450–700 GW associated with technology upgrades.
Those are high-level global estimates across queued projects, not capacity reserved for data centers or guaranteed to be deliverable immediately. The IEA says project-level studies remain necessary: voltage, short-circuit, substation, generation and load constraints can change what is feasible at a specific location. Flexible agreements may also impose operating limits, while network upgrades require local planning and approval.
What should a data center developer assess first?
Early utility engagement is useful because the power plan, site and operating model depend on one another. A developer can use the following sequence to frame the discussion with utilities, system operators and energy providers:
- Define the load. Specify the expected capacity, phasing and operating profile, including which loads can be shifted or curtailed. A campus headline number alone does not describe its connection needs.
- Test the site against local grid conditions. Ask about hosting capacity, queue requirements, connection studies and likely upgrades. A global estimate cannot substitute for a site-specific assessment.
- Set reliability and flexibility requirements. Identify which operations require continuous service, how much interruption or curtailment is acceptable, and whether storage or demand response can support the operating plan.
- Compare supply structures. Evaluate grid-only supply, a grid-plus-generation arrangement, storage and flexible connection terms against the same needs: timing, reliability, contract horizon, offtake, permitting, fuel or resource access, emissions and site fit.
- Align commitments with infrastructure lead times. Clarify what long-term power purchase or offtake commitments are required to support investment, separately from the expected schedule for the project’s grid connection.
For context on the wider U.S. system, the U.S. Department of Energy’s 2025 modeled reference projects average-year coincident peak load rising from 774 GW to 889 GW by 2030, a 15% increase. Under the report’s assumptions, excluding data centers, the modeled increase is 51 GW, taking load from 774 GW to 826 GW. This is one U.S. modeling scenario, not a global forecast; the methodology and regional distribution matter when interpreting the totals.
Quick Recap
Product prices and availability are accurate as of the date/time indicated and are subject to change. Any price and availability information displayed on Amazon at the time of purchase will apply.

