The Tool Desk
Outbyte PC Repair FREEClear out junk files and repair common Windows errorsFree Scan →Outbyte Driver Updater FREEFix the driver behind crashes, sound loss and screen glitchesFind Drivers →If a hitch lines up with a spike in frame time, the problem is local rendering or other work on your device. If frame timing stays steady while ping, packet loss or jitter worsens, the connection is the stronger suspect. Check both sets of measurements during the same hitch: the visual symptom alone cannot reliably distinguish them.
What the two problems mean
Shader compilation stutter is a rendering hitch. A game encounters a shader or graphics pipeline state it has not prepared yet, and the render path pauses while the driver compiles it. Epic Games engineers described this in 2025 as a case where the engine discovers it needs a new shader just before drawing, so rendering waits for compilation to finish. The result is a local frame-time spike, which can look like a brief freeze or uneven motion.
As an Amazon Associate I earn from qualifying purchases.
Network lag is a communication problem between your game and its server. The client may keep drawing frames normally, but delayed or missing network data can make your input, other players’ positions or the shared game state arrive late or inconsistently. Epic defines latency as the time data takes to travel from your device to a server and back. Ping, packet loss and jitter help describe what is happening on that connection.
Do these 3 things before closing this tab:
1Clear out junk files and repair common Windows errors2Scan for outdated or missing drivers - takes under a minute3Repair Windows errors before they cause bigger problemsThese problems can feel similar because both interrupt smooth play. They affect different layers, though: one is about producing frames on your device; the other is about exchanging timely game data. A game can have one problem, both at once, or neither. For example, a shader hitch can happen during a perfectly stable match connection, while a player can rubberband during a session in which the frame rate never drops.
#1 Best Overall
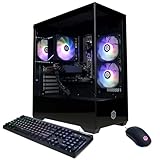
- System: AMD Ryzen 5 5500 3.6GHz 6 Cores | AMD B550 Chipset | 8GB DDR4 | 500GB PCIe 4.0 NVMe SSD | Windows 11 Home
- Graphics: AMD Radeon RX 6500 XT 4GB Graphics | 1x HDMI | 1x DisplayPort
- Connectivity: 4 x USB-A 3.2 | 4 x USB-A 2.0 | 1 x LAN | WiFi 5 | Bluetooth 5.0 | 7.1 Channel Audio
- Tempered Side Case Panel | Custom RGB Lighting | Keyboard and Mouse
- 1 Year Parts & Labor Warranty, Free Lifetime Tech Support
Compare the symptoms and measurements
| What to compare | Shader or pipeline compilation is more plausible when… | Network lag is more plausible when… |
|---|---|---|
| Measured layer | Frame time or the game’s Game, Render or GPU timing rises during the hitch. | Ping, packet loss or jitter becomes high or inconsistent during the event. |
| Typical trigger | A visual effect, material or pipeline state appears for the first time, especially after a cache reset or driver change. | Connection conditions, server conditions or the route to the server change. |
| What play can look like | A brief freeze, a missed frame or uneven local motion. | Rubberbanding, delayed actions, late updates or corrections to remote players’ positions. |
| What happens on repeat attempts | The hitch may become less frequent after the relevant cached data has been prepared. | The problem may vary with connection load, route or server region rather than becoming reliably better after seeing an effect once. |
| Relevant mitigation | For game developers, prepare pipeline states or compile shaders asynchronously where supported. | Use the telemetry to guide connection troubleshooting, such as checking competing network load or server-region selection. |
These are clues, not proof. A frame-time spike establishes that local work coincided with the hitch, but does not by itself identify shader compilation as the cause. Likewise, a connection graph that looks normal after the event does not show what it was doing during the hitch. Record both measurements at the instant of the event.
Why a high FPS counter does not settle the question
An average FPS number can remain high while a single frame takes far too long to finish. For instance, a game may report a comfortable average and still pause for one unusually long frame when a new effect is compiled. Frame time, measured in milliseconds, exposes that spike more clearly than an FPS average. A network problem can produce the opposite experience: frames continue to arrive on schedule, but the server state or your input arrives late. You may see a stable frame graph while a car, character or projectile snaps to a corrected position.
Do not use a single visual cue as a verdict. “It feels choppy” describes presentation, not the layer causing it. “My ping is fine” is also incomplete unless the ping was observed during the hitch and packet loss and jitter were checked. A short burst of loss or variation can be missed by an idle test.
What’s actually slowing this PC down?
Pick the symptom - the matching free tool is one click away.
Measure both layers during the same hitch
Use the game’s performance overlay or telemetry if it provides both frame and network information. Epic’s Rocket League support documentation separates Frame, Game, Render and GPU timings and offers network graphs. The exact labels and availability depend on the game; use its own documentation if the menu differs. Some titles expose only a subset of these values, so write down what is available rather than assuming an absent graph means a normal result.
- Enable the available graphs. Turn on frame or performance timing and network telemetry before reproducing the problem. In Rocket League, consult its support instructions for the in-game performance and network graphs. If the overlay can be logged or recorded, capture a short clip that includes the graph and the game view.
- Define one reproducible action. Pick the same doorway, material, spell, weather effect or combat encounter. Reproducing one event is more useful than wandering through unrelated areas, because it lets you compare cold and warm runs.
- Reproduce the same event. Repeat the action that usually causes the hitch while watching both sets of graphs. If practical, note the clock time or record the screen so you can match the hitch to the measurement rather than relying on memory.
- Check local timings at that moment. Look for a frame-time spike and inspect the available Game, Render and GPU values. A rise points toward local work, but it can also come from loading, spawning, scene captures or other traversal activity; it is not a shader-specific diagnosis.
- Check the network graphs at that moment. Look for changes in ping, packet loss or jitter. A steady local frame graph alongside abnormal connection telemetry makes network trouble more plausible. A brief spike that disappears afterward still matters if it lines up with the symptom.
- Repeat before changing settings. Make several attempts under similar conditions. One coincidental spike can mislead you, whereas a metric that changes every time the hitch occurs is a stronger lead.
When only one measurement is available, the diagnosis is less certain. A smooth-looking picture does not rule out a network problem, and a rubberbanding character does not establish that your frame rate is healthy. Use the game’s data rather than relying on appearance alone.
Read the pattern: first-use hitch or recurring connection problem?
A hitch on the first encounter
If a hitch happens when a material, effect or area appears for the first time and becomes less frequent on later encounters, shader or pipeline-state compilation is plausible. Compiled shader data can be stored in Unreal Engine’s Derived Data Cache, and Unreal supports asynchronous shader compilation. That makes a cold-versus-warm comparison useful: note what happens the first time, repeat the same action, and see whether the hitch changes as cached work becomes available.
A driver update, game update or deliberate cache reset can recreate a cold state. The first run after one of those events may therefore be worse even though the installation is healthy. Let any built-in shader-preparation stage complete, then test again. Do not treat every post-update hitch as proof of a shader issue; the update can also change assets, settings or server behavior.
Quick wins for a faster PC:
Clear out junk files and repair common Windows errorsFree Scan →Scan for outdated or missing drivers - takes under a minuteDriver Scan →Repair Windows errors before they cause bigger problemsFix Now →This pattern is suggestive rather than conclusive. Entering an area can also trigger asset streaming or other traversal work, so a first-use hitch is not automatically a shader hitch. Confirm that local timing rises and use the game’s or developer’s profiling tools before assigning a specific cause.
A hitch that repeats with no warm-up improvement
If the same action hitches just as often after several warm runs, compilation becomes less certain. Persistent loading, excessive spawning, scene captures or another game-thread or GPU task may be responsible. Compare the Game, Render and GPU portions of the frame timing to see whether the work is concentrated in one part of the pipeline. If the overlay does not identify the task, the developer’s profiling guidance is the appropriate next step.
Rank #2

- 8-Core 16-Thread Processing Power – Powered by the Ryzen 7 4700LE processor with Zen 2 architecture, delivering 8 cores and 16 threads with a boost clock up to 4.2GHz. Effortlessly handle multitasking, streaming, content creation, and demanding applications simultaneously without slowdowns.
- GeForce RTX 3050 8GB Graphics – Equipped with 8GB GDDR6 dedicated VRAM and real-time ray tracing support. Experience smooth 1080p gaming at 55-60 FPS in AAA titles like Cyberpunk 2077, 70+ FPS in Fortnite, and 90-100 FPS in Apex Legends with DLSS enabled. The 8GB buffer handles modern game textures comfortably – a step above 6GB variants
- High-Speed Memory & Storage – Paired with 16GB of DDR4 3200MHz dual-channel RAM (16GB), the PC ensures responsive multitasking—whether streaming while gaming or editing videos. It also includes a 512 GB NVMe M.2 SSD for lightning-fast boot times, quick game loads, and ample storage for your game library, creative projects, and files.
- Next-Gen WiFi 6 Connectivity – Stay connected with the latest WiFi 6 technology for faster speeds, lower latency, and improved network efficiency. Whether you're gaming online, streaming 4K content, or joining video conferences, enjoy stable, high-speed wireless connectivity.
- Ready-to-Use Value Desktop – Pre-built and ready to go right out of the box. Perfect for gamers, students, content creators, and home office users seeking reliable performance without the hassle of building a PC themselves. The mature AM4 platform with DDR4 memory offers excellent value and proven stability.
A hitch with rubberbanding or delayed updates
If your local frame timings remain steady while remote players jump, your movement is corrected, actions register late, or network values become unstable, investigate the connection path. Epic Player Support says packet loss consistently above about 1% will cause problems in game. It also advises comparing minimum and maximum latency: they should be reasonably close, because variation in latency—jitter—matters as well as the average.
Average ping alone can hide a bad interval. A connection might show an acceptable average while alternating between short and long delays. Look for a wide spread between the minimum and maximum readings, repeated loss, or jitter that rises at the same time as the visible correction. A good-looking idle reading is not decisive. A connection can behave differently under load, so observe the telemetry while playing through the event rather than checking only when the game is quiet.
Recommended Free Tools
A controlled test that separates the layers
You can make the comparison more reliable by changing one condition at a time. First, run the same local route or effect with the usual network conditions and record frame and network values. Then repeat it without changing graphics settings. If the hitch warms away while network readings remain similar, local cached work is a reasonable lead. If the hitch moves with packet loss or jitter while local timing remains flat, connection conditions deserve priority.
Next, test a different online match or server region if the game offers that choice. A change that follows the region or route points toward network conditions; a hitch that follows the same material or effect on every region points toward local work. These tests do not prove a shader compile, because asset loading and other local tasks can follow the same visual trigger, but they prevent an unrelated network change from being blamed on rendering.
Keep a small log with the date, game version, driver-change or cache-reset status, location in the game, frame-time peak, ping range, packet-loss reading and jitter. The purpose is not to collect perfect laboratory data; it is to determine whether the same metric changes every time the symptom appears. Stop changing settings once you have a repeatable pattern, or you will lose the comparison baseline.
Rule out other local causes before blaming shaders
Unreal Engine engineers identify synchronous loading, excessive spawning, scene captures and other traversal work as possible sources of frame-time spikes. A hitch while moving through a world can therefore be local without being shader compilation. Frame, Game, Render and GPU timings help locate which part of the pipeline is busy, but a more specific diagnosis may require the game developer’s profiling tools.
- Local timing rises; network values stay steady: investigate rendering, game-thread work, GPU work and loading. A first-use pattern can make compilation more plausible, but timing data alone does not name the cause.
- Local timing stays steady; network values worsen: focus on latency, loss, jitter and the conditions of the connection to the game server.
- Both sets of values worsen: both local and network conditions may be involved. Treat them as separate signals and repeat the test; one does not explain away the other.
- Neither graph changes: the available graphs may not capture the relevant event, or the symptom may have another cause. Check that telemetry is enabled and timed to the hitch, then consult the game’s support or profiling guidance.
Other local work can include an area’s assets being streamed, many actors being spawned at once, or a scene capture updating. Those tasks can occur on the first traversal and can improve or worsen independently of shader caches. Avoid declaring “shader stutter” solely because the hitch occurs near a new visual effect.
What to try if local shader or pipeline work is implicated
As a player
If the game provides a shader-preparation step, let it finish after installation, a graphics-driver change or a cache reset before judging performance in play. A preparation screen is designed to move compilation out of active gameplay; interrupting it can leave the next run cold again. A cache reset can make the next run a cold run, so compare it with later attempts rather than treating the first hitch afterward as evidence that the reset failed.
Do not clear caches speculatively. Follow the game’s or developer’s directions, since cache behavior and supported reset procedures vary by title. Clearing a cache can increase the amount of work on the next launch and does not repair a network path. Likewise, lowering a graphics option may alter which effects are used, but it is not a diagnostic substitute for watching frame timing and network telemetry.
Rank #3

- POWERHOUSE 8-CORE GAMING PERFORMANCE — Driven by the AMD Ryzen 7 8700F with 8 cores and 16 threads, boosting up to 5.0 GHz for smooth, responsive gameplay and the ability to handle AAA titles, streaming, and background tasks all at once
- NEXT-GEN BLACKWELL ARCHITECTURE — The NVIDIA GeForce RTX 5070 is powered by NVIDIA's cutting-edge Blackwell GPU architecture, delivering a massive generational leap in rasterization and ray tracing performance so you can experience your games the way they were meant to be played.
- Simplistic Design: Enjoy the latest generation of Windows 11 Home for your everyday needs. *MSI recommends Windows 11 Pro for business use.
- Cool While Gaming: In conjunction with an ARGB fan Air Cooler, the Codex R2 features four system cooling fans; three in the front and one in the rear to pull in cool air and push heat out of the PC.
- Turn on the Bright Lights: With the built-in RGB lighting, take your gaming experience to the next level by pressing the MSI LED button to cycle through lighting options. Customize lighting even further with MSI Center software.
As a developer
Unreal Engine guidance recommends PSO caching or precaching to prepare pipeline states before they are needed, reducing runtime compilation and hitching. Epic’s developer guidance also describes asynchronous shader compilation and shader compile workers. Preparing states in advance can dramatically reduce the amount of shader compilation performed during runtime and therefore reduce hitches when new areas and materials load. These are development-side approaches; players generally cannot enable them unless a particular game exposes a related option.
PC Slower Than It Used to Be?
A free scan shows the junk files, broken settings and background clutter dragging Windows down - then fixes them in one click.Free scan · Windows 10 & 11Crashes, No Sound, or Screen Glitches?
Random freezes, missing sound and display glitches usually trace back to one bad driver. Find and replace yours safely.Free scan · under a minuteFor first-run testing, Epic’s PSO guidance recommends clearing the PSO driver cache and validating PSO misses. That creates a controlled cold-cache test; compare it with a warm run and use profiling to determine whether the missing pipeline state corresponds to the hitch. A developer should also test traversal work, spawning and scene captures separately so a PSO fix is not credited for an unrelated frame spike.
What to try if network telemetry is implicated
Choose a change that addresses the measurement that worsened, then reproduce the same event and check whether that value improves. Network troubleshooting is not a substitute for frame-time diagnosis, and buying a particular component does not establish which layer caused a hitch.
- Check competing traffic. Downloads and streams can add load to a connection. If the problem appears while other devices or apps are active, pause that traffic and compare the in-game telemetry. A change is useful only if packet loss, jitter or latency actually improves during play.
- Check Wi-Fi conditions. Congestion can affect the connection path. Compare a run under different Wi-Fi conditions, if available, and use the same in-game graphs to judge the result. Do not infer success from a faster speed test if the game’s loss and jitter remain unchanged.
- Check the selected server region. If the game lets you choose a region, compare the available settings using ping and stability rather than assuming a region is better. A lower average is not enough if variation or loss is higher.
- Use router controls only with a measured reason. Router QoS settings may matter in a loaded network, but the useful configuration depends on the router and connection. Change one relevant setting at a time and verify the effect in the network graph.
Epic’s packet-loss guidance gives a useful warning threshold, not a guarantee that every reading below it is harmless. Persistent loss, wide variation between minimum and maximum latency, or a rise in jitter during play all warrant attention even if a single ping test looks good. Server-side problems can also affect a match; if several players report the same behavior and your local telemetry is normal, provide the game’s support team with the time, region and graph readings.
Independent reader supportYour contribution helps us test, update, and keep practical guides available for everyone.When a purchase is, and is not, justified
No GPU, Ethernet cable, router, SSD, RAM kit or generic PC-cleaning utility can distinguish shader compilation from network lag on its own. A faster graphics card might reduce a sustained rendering bottleneck but will not remove a server-side delay. An Ethernet cable may improve a congested Wi-Fi path but cannot fix a local shader compile. Consider hardware only after the measurements show a persistent limitation and after software, cache and connection tests have isolated the relevant layer. There is no universal cost-effective upgrade for this diagnosis; telemetry should determine the next step.
Frequently asked questions
Why does my game stutter when my ping is fine?
Ping can be normal while a local frame takes too long. Check frame time and the Game, Render and GPU timings at the exact hitch. A first-use effect, cache reset or driver change makes shader or PSO work plausible, but loading, spawning and scene captures can produce the same local spike.
Can network lag happen when FPS is high?
Yes. The client can render frames normally while delayed or missing packets affect input and remote-player state. Stable frame timing combined with rubberbanding, late actions, packet loss or rising jitter points toward the connection layer.
Is every first-time area hitch shader compilation?
No. First traversal can also stream assets or perform other work. Repeat the route, compare cold and warm runs, and inspect local timing. A warm-up improvement supports a cached-work explanation but does not identify compilation without profiling.
What packet-loss level should concern me?
Epic Player Support says anything consistently above about 1% causes problems in game. Also check jitter and the spread between minimum and maximum latency, because an acceptable average can hide unstable delivery.
Rank #4

- POWERED BY RTX 5070 12GB + RYZEN 7 9700X - The GeForce RTX 5070 12GB GDDR7 graphics card pairs with an 8-core AMD Ryzen 7 9700X processor to drive smooth 1440p and 4K gameplay, giving this gaming PC the headroom for modern titles, streaming, and creative work.
- 32GB DDR5 6000MHz MEMORY & 1TB NVMe SSD - 32GB of high-speed DDR5 memory and a 1TB PCIe 4.0 NVMe solid state drive deliver quick load times, smooth multitasking, and generous storage, keeping this prebuilt gaming desktop responsive under heavy workloads.
- BUILT-IN 11.3-INCH Smart DISPLAY - An integrated smart screen shows real-time CPU and GPU temperatures, usage, and weather while you play, adding a distinctive and functional touch to your battlestation.
- 850W 80+ GOLD POWER SUPPLY, 360MM LIQUID COOLING & WiFi 7 - An 850W 80 Plus Gold certified power supply provides stable, efficient power with headroom for future upgrades, while a 360mm AIO liquid cooler, WiFi 7, and an ARGB mid-tower case keep the Ryzen 7 CPU cool and connected in a clean build.
- READY TO PLAY OUT OF THE BOX - Arrives fully assembled and tested with Windows 11 Home pre-installed, so your prebuilt gaming computer is ready to set up in minutes. Assembled in the USA, and backed by a one-year limited warranty and lifetime free technical support.
Should I clear my shader or PSO cache?
Only when the game or developer documentation supports it. Clearing creates a cold run and can make the next launch hitch more. Use it for a controlled comparison, not as a routine cure for network symptoms.
Why do both frame time and ping spike together?
The two conditions can coexist, or one event can cause work in both layers. Repeat the test, separate local and network changes, and address each metric independently. A network spike does not explain a GPU spike, and vice versa.
Which overlay should I use?
Use the game’s own telemetry first. Rocket League, for example, separates Frame, Game, Render and GPU timings and provides network graphs. Other games expose different labels, so follow their support instructions and compare whatever frame and connection data they provide.
When should I contact the game developer or support team?
Contact them after you can describe a repeatable trigger and provide timing data. Include whether the run was cold or warm, the game and driver version, the selected region, frame-time behavior, ping range, packet loss and jitter. That information is more actionable than reporting only that the game feels laggy.
Free tools Windows power users keep installed
One-click scans. No signup required.
Frequently Asked Questions
What is the quickest way to tell shader stutter from network lag?
Enable frame-time and network graphs, reproduce the same hitch, and compare the readings at that moment. A local frame, Game, Render or GPU spike favors rendering or loading; abnormal ping, packet loss or jitter with steady frame timing favors network lag.
Why does rubberbanding happen when my FPS is high?
Rubberbanding is usually a delayed or corrected network state. Check ping, packet loss and jitter during the correction; high FPS does not guarantee timely server communication.
Does a first-use hitch prove shader compilation?
No. It makes shader or PSO compilation plausible, especially after a cache reset or driver update, but asset streaming, spawning and scene captures can also hitch on first traversal.
Is 1% packet loss serious?
Epic Player Support says packet loss consistently above about 1% will cause problems in game. Also examine jitter and the difference between minimum and maximum latency.
Should I buy an Ethernet cable or new GPU first?
Neither purchase is a valid first diagnosis. Use telemetry to establish whether the problem is network delivery or local frame production, then address the measured bottleneck.
The Bottom Line
Match the symptom to measurements taken during the same event. A frame-time spike—especially on first use and reduced by a warm cache—points to local rendering or compilation, while rubberbanding with packet loss, unstable ping or jitter points to the network. Because loading and other local work can mimic shader stutter, profile before naming the cause, and change one measured factor at a time.
Quick Recap
Product prices and availability are accurate as of the date/time indicated and are subject to change. Any price and availability information displayed on Amazon at the time of purchase will apply.

