Short answer: Run:ai workload fields describe the GPU resources an individual workload requests; they are not a complete, cluster-wide scheduler policy. In Run:ai v2.19, gpu requests a GPU fraction, gpuDevices requests a device count, gpuLimit sets the limit for a fractional request from 0 to 1, and gpuMemory blocks scheduling until that memory can be guaranteed. Queue ordering, fair-share enforcement and preemption depend on administrator policy in the deployed release, so use the matching version’s administrator documentation rather than inferring scheduler defaults from a workload manifest.
What the scheduler settings actually control
There are three separate layers to keep straight:
- Workload request: the GPU quantity, device count, fraction limit and memory a workspace, training job, distributed job or inference workload asks Run:ai to allocate.
- Cluster scheduling policy: the rules that decide which eligible workload runs next, how projects receive fair-share portions, whether training jobs may be preempted, and how queues are handled.
- Operations and diagnosis: dashboards and logs that show allocations, quotas, pending work, wait times, node capacity and scheduler decisions.
The v2.19 YAML reference documents the first layer. It does not provide a complete catalog of scheduler keys or defaults for enabling GPU sharing and fairness. Therefore, changing a workload’s gpu value does not, by itself, create or alter a project’s fair-share policy. Conversely, a project policy cannot satisfy a workload request that no node can physically host.

As an Amazon Associate I earn from qualifying purchases.
Version scope: match every setting to your deployment
The available official pages cover different releases. Use them for the purpose shown below, then open the administrator documentation for the exact version installed in your cluster before copying configuration.
What’s actually slowing this PC down?
Pick the symptom - the matching free tool is one click away.
| Documentation | Release context | What it establishes |
|---|---|---|
| Workload YAML Reference | v2.19 | Definitions and ranges for gpu, gpuDevices, gpuLimit and gpuMemory. |
| Dashboard Analysis | v2.18 | How to investigate allocations, fair-share portions, queues, quotas and node fit. |
| Diagnostics | Latest documentation | How to increase scheduler log verbosity and the associated disk-space warning. |
A “latest” page can describe a release newer than yours, while dashboard labels and configuration structures can change between versions. Record the Run:ai control-plane version and the Kubernetes cluster context before applying a setting, and verify that the field or key exists in that release.
#1 Best Overall

- NVIDIA Volta GV100 Architecture — 4,608 CUDA Cores, 640 1st-Gen Tensor Cores delivering 14 TFLOPS FP32 and 112 TFLOPS deep learning performance for AI training, inference, HPC, and scientific computing workloads
- 32GB HBM2 ECC Memory — 900 GB/s Bandwidth — High-bandwidth memory on a 4096-bit bus with ECC error correction provides the memory capacity and throughput required for the largest AI models, simulations, and datasets
- PCIe 3.0 x16 Interface — 250W TDP — Standard PCIe Gen3 connectivity with passive cooling designed for enterprise rack server deployment in HPE ProLiant, Dell PowerEdge, and Supermicro platforms with adequate chassis airflow
- NVLink — Scale to 96GB Unified Memory — Connect two V100 GPUs via NVLink at 300 GB/s bi-directional bandwidth to scale GPU memory from 32GB to 96GB for larger AI training and HPC workloads
- Multi-Precision Computing — Supports FP64 (7 TFLOPS), FP32 (14 TFLOPS), FP16 (112 TFLOPS) and INT8 precision modes for flexible deployment across training, inference, and scientific simulation workloads
Workload GPU fields in the v2.19 YAML reference
These fields tell Run:ai what one workload needs. They should be treated as resource requests and constraints, not as a fairness configuration interface.
| Field | Meaning | Important qualification |
|---|---|---|
gpu |
Fraction of a GPU allocated to the workload. | Use it to express fractional demand; the field does not define how the cluster shares GPUs among projects. |
gpuDevices |
Number of GPU devices to allocate. | The reference supports a device count greater than one for backward compatibility. |
gpuLimit |
Portion limit for a fractional GPU request. | The documented range is 0 through 1. It limits the portion when the request is fractional. |
gpuMemory |
Amount of GPU memory allocated to the workload. | Scheduling waits until Run:ai can guarantee the requested amount; available GPU compute alone is not enough. |
The definitions apply across the documented workspace, training, distributed and inference workload types. A manifest can therefore accurately describe a fractional GPU or a memory requirement while still remaining subject to the cluster’s queue and project policy.
Fractional GPU versus device-count requests
Choose the field that matches the workload’s actual requirement. A fractional request expresses a portion of one GPU, whereas gpuDevices expresses whole device count. Do not assume that setting both fields produces a larger or more permissive allocation; confirm the precedence and validation rules in the schema for your installed version. For older manifests that use a device count, the v2.19 reference retains support for more than one device for backward compatibility.
Portion limits are not fair-share limits
gpuLimit is bounded from 0 to 1 and concerns the portion granted to that workload’s fractional request. A value in this field does not reserve a project’s share of the cluster and does not determine queue priority. Project portions, quotas and preemption behavior must be inspected in administrator policy and in the dashboard.
GPU memory can be the reason a job waits
When gpuMemory is present, Run:ai must be able to guarantee that amount before scheduling. A cluster may show free GPU compute while every available device lacks a contiguous or otherwise suitable memory amount. Treat the memory requirement as a hard placement constraint when diagnosing a pending workload.
How to investigate queues and fairness in the dashboard
The v2.18 Dashboard Analysis guidance separates two common situations: a fully loaded cluster where projects may be competing for their portions, and a cluster that is not full but still has pending work.
Rank #3

- Colour: brown
- Brand: Nvidia
- Packed with features
- Best product in its class
When the cluster is fully loaded
- Open the dashboard’s project or allocation view and identify each active project’s allocated GPU and CPU counts.
- Compare each project’s current allocation with its configured fair-share portion. A project receiving less than its portion may be waiting for resources, while a project above its portion may be a candidate for policy-driven throttling or preemption.
- Check whether pending work belongs to interactive or training workloads. Training workloads can be preempted, queued and resumed automatically when the predefined policy allows it.
- Record the pending queue size and wait time so that a temporary burst is distinguishable from a persistent imbalance.
This procedure measures how policy is operating; it does not reveal an undocumented scheduler key. If the observed allocations do not match the intended portions, consult the administrator configuration for the deployed release before changing workload requests.
Free tools Windows power users keep installed
One-click scans. No signup required.
When the cluster is not fully loaded but work is queued
- Open the pending workload details and write down its requested CPU, CPU memory, GPU and GPU memory.
- Check whether any node has enough free resources to satisfy all of those requests simultaneously.
- Pay particular attention to GPU memory. A free device that cannot guarantee the requested memory is not a valid placement target.
- Check node fit rather than cluster totals. Fragmented CPU, memory or GPU capacity can leave a workload pending even when the aggregate free amount appears sufficient.
- Compare the workload’s request with the project’s quota and current allocation; a quota restriction can block placement even when a node has capacity.
Quota, allocation and pending work are different metrics
| Metric | What it answers | How to use it |
|---|---|---|
| Quota | How much resource a project has reserved for use. | Use it to identify a project-level ceiling. |
| Allocation | How much resource the project is currently using. | Compare with quota and fair-share portions. |
| Pending count | How many workloads are waiting. | Track bursts and sustained backlog. |
| Wait time | How long pending workloads have waited. | Expose starvation or an unsatisfied placement constraint. |
| Node free resources | Whether one node can host a workload’s complete request. | Use during placement troubleshooting; cluster-wide totals can mislead. |
A practical administrator workflow
Use this sequence before editing any scheduler configuration. It keeps a workload error from being mistaken for a fairness problem.
- Identify the installed release. Capture the Run:ai version and use its matching workload, platform-admin and troubleshooting pages. Treat v2.19 field definitions, v2.18 dashboard instructions and the latest diagnostics page as version-scoped references, not one universal configuration contract.
- Classify the symptom. Decide whether the cluster is fully loaded, partially loaded with a queue, or failing to place one particular request. This determines whether fair-share analysis, node-fit analysis or request validation comes first.
- Validate the workload request. Confirm whether the manifest uses a GPU fraction (
gpu), device count (gpuDevices), a portion limit (gpuLimit) or a memory guarantee (gpuMemory). Check the documented range and workload type for your release. - Inspect project state. Compare allocated GPU/CPU resources with fair-share portions and quota. Include pending count and wait time in the incident record.
- Check physical placement. Find a node with enough free CPU, CPU memory, GPU capacity and GPU memory at the same time. If no node fits, changing queue priority will not solve the immediate placement failure.
- Check workload class and policy. Determine whether the workload is interactive or training and whether the predefined policy permits training preemption, queuing and resumption.
- Enable temporary diagnostics if needed. In
RunaiConfig, edit the scheduler section and add therunai-schedulerarguments used by your release, raising verbosity to 6 as shown in the diagnostics guide. Apply the change only for the troubleshooting window and monitor disk usage. - Return verbosity to normal. The official warning is: “Verbose scheduler logs consume a significant amount of disk space.” Remove or lower the diagnostic setting after collecting the relevant scheduling decisions.
Decision table for common symptoms
| Observed symptom | First checks | Likely layer |
|---|---|---|
| One workload remains pending while other GPUs appear idle | Requested GPU memory, complete node fit, CPU and CPU-memory requests | Workload constraint or placement |
| Several projects compete during full utilization | Allocated GPU/CPU by project, fair-share portions, quota, pending wait time | Cluster policy and queue state |
| Training jobs disappear and later return | Workload type and predefined preemption/resumption policy | Operational scheduling policy |
| A project cannot start work despite apparent capacity | Allocation versus quota and pending workloads | Project quota or policy |
| Scheduling behavior is unclear from dashboard data | Temporarily raise scheduler verbosity in RunaiConfig; watch disk consumption |
Diagnostics |
What is not established by the documented fields
The cited workload reference does not establish the exact scheduler keys, default fair-share weights, queue names, preemption thresholds or GPU-sharing enablement switches for every Run:ai release. Do not manufacture a copy-paste scheduler manifest from the four workload fields. Before changing cluster policy, locate the administrator scheduler reference for the deployed version and verify:
Rank #4
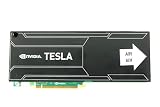
- Bulk Pack without retail box
- How projects are assigned fair-share portions and whether those portions are weighted or hierarchical.
- Which queues exist and how workloads enter them.
- Whether and when training workloads may be preempted, queued and resumed.
- How quotas interact with fair share and current allocations.
- Whether fractional GPU sharing requires an explicit cluster feature or has release-specific prerequisites.
- Which
RunaiConfigstructure and scheduler arguments are valid in that version.
If the administrator reference does not document a key or default, treat it as unknown rather than relying on behavior observed in another release.
Configuration checklist before production changes
- Match every field and key to the installed Run:ai release.
- Keep workload requests separate from project-level fairness policy in change reviews.
- Validate both GPU compute and GPU memory requirements.
- Record quota, allocation, fair-share portion, pending count and wait time before and after a policy change.
- Test with representative interactive and training workloads, since their preemption behavior may differ.
- Use verbose scheduler logging only for diagnosis, with a disk-space plan and a defined rollback time.
- Document the intended outcome: higher utilization, a specific fair-share correction, shorter queue wait, or successful placement of a memory-constrained job.
Sources and release-specific references
For field semantics, use the Run:ai v2.19 Workload YAML Reference. For allocation, quota, fair-share and queue diagnosis, use the Run:ai v2.18 Dashboard Analysis guide. For scheduler verbosity and logging cautions, use the Run:ai Diagnostics documentation, then confirm that its instructions match your deployed version.
The Bottom Line
Use workload GPU fields to state demand, dashboard metrics to verify allocation and fairness, and the version-matched administrator reference to change scheduler policy. The fields alone do not configure cluster-wide GPU sharing or fair-share behavior.
Quick Recap
Product prices and availability are accurate as of the date/time indicated and are subject to change. Any price and availability information displayed on Amazon at the time of purchase will apply.

