The Tool Desk
Outbyte PC Repair FREEClear out junk files and repair common Windows errorsFree Scan →Outbyte Driver Updater FREEFix the driver behind crashes, sound loss and screen glitchesFind Drivers →Use PUE as the primary metric for standardized data-center efficiency reporting. ISO/IEC 30134-2:2026 defines how to measure, calculate, report and interpret Power Usage Effectiveness (PUE). DCiE (Data Center infrastructure Efficiency) is simply the reciprocal of PUE, usually shown as a percentage. It can be easier for a nontechnical audience to read, but it adds no independent information. Report PUE with its boundary, measurement category and period; add DCiE only when a percentage presentation helps your audience.
What PUE and DCiE actually measure
Both metrics describe the relationship between energy used by a data center’s information-technology equipment and energy used by the entire facility. Neither measures the amount of useful work produced by servers, storage or networking equipment.

As an Amazon Associate I earn from qualifying purchases.
Power Usage Effectiveness (PUE)
ISO/IEC 30134-2:2026 defines PUE as total data-center energy consumption divided by IT-equipment energy consumption, measured over the same continuous 12-month period:
PUE = total data-center energy ÷ IT-equipment energy
The numerator covers the complete data-center boundary selected for the report. It normally includes IT loads plus cooling, lighting, power distribution losses and other supporting infrastructure inside that boundary. The denominator is the energy delivered to the IT equipment under the selected measurement category.
Data Center infrastructure Efficiency (DCiE)
DCiE reverses the same relationship and generally expresses the result as a percentage:
DCiE = (IT-equipment energy ÷ total facility energy) × 100%
Do these 3 things before closing this tab:
1Clear out junk files and repair common Windows errors2Fix the driver behind crashes, sound loss and screen glitches3Repair Windows errors before they cause bigger problemsBecause it is the reciprocal, the conversion is direct:
DCiE = (1 ÷ PUE) × 100%
PUE = 100% ÷ DCiE
A lower PUE and a higher DCiE both indicate that less supporting-facility energy is being used for each unit of IT energy. They are two ways of presenting one ratio, not two independent measurements.
PUE versus DCiE at a glance
| Question | PUE | DCiE |
|---|---|---|
| What is it? | Total data-center energy divided by IT-equipment energy | IT-equipment energy divided by total facility energy |
| Typical display | Dimensionless ratio, such as 1.40 | Percentage, such as 71.4% |
| Favorable direction | Lower | Higher |
| Information content | Primary infrastructure-efficiency KPI in ISO/IEC 30134-2:2026 | Exactly the reciprocal of PUE; no additional efficiency information |
| Best use | Standardized reporting, contracts, engineering analysis and facility comparisons with declared boundaries | Plain-language communication when a percentage is more intuitive |
| What it does not measure | Useful computing output, carbon, water, equipment utilization or service quality | |
Why PUE should be your primary reporting metric
The current reference point is ISO/IEC 30134-2:2026, edition 2, published in January 2026. It specifies PUE measurement categories, calculation, reporting and interpretation. If your organization needs a metric that aligns with the current international data-center KPI framework, PUE is the appropriate headline value.
DCiE remains useful as a companion display. A facilities report can state, for example, “PUE 1.40 (DCiE 71.4%), calculated for the declared boundary over the continuous 12-month reporting period.” The percentage helps readers who find a ratio less intuitive, while PUE preserves the terminology used by the standard and by most engineering and sustainability reports.
Rank #2

- Superior Charging Performance Monitoring: Monitor the charging performance of all USB and Type C devices, including wall and solar panel chargers as well as USB cables. This tester can accurately measure voltage (3.6V-32V) and current (0-8.0A), making it ideal for assessing power bank capacity and electric energy.
- Broad Compatibility with Quick Charging Protocols: Supports the latest PD and QC fast-charging protocols, including PD3.0/2.0, QC3.0/2.0, and BC1.2. Compatible with a wide range of devices, from the newest iPhone 16 Pro to MacBook Pro, Dell XPS, Chromebook, Surface Pro, and more, ensuring versatility across USB A and Type C ports.
- Comprehensive Safety Protections: Equipped with over-voltage, over-current, under-voltage, and low energy protection. This tester automatically cuts off power if it detects any issue, preventing damage to your devices. It also saves data during sudden power outages, preserving valuable information.
- IPS Color Display with Easy Interface Navigation: This upgraded USB tester features a vivid, high-resolution display with eight color-screen interfaces. Easily switch views to monitor voltage, current, capacity, power, load impedance, and more, all in one glance.
- Precise Power Bank Capacity Testing: Accurately test power bank capacity either by direct load testing or by calculation. To determine capacity, charge the power bank fully and divide the Wh reading by battery voltage (e.g., 35Wh ÷ 3.7V = 9.46Ah or 9460mAh), offering reliable insight into actual capacity.
Do not present the two numbers as separate improvements. Moving from a PUE of 1.50 to 1.40 automatically changes DCiE from 66.7% to 71.4%; it does not represent two independent gains. A dashboard that shows both should label DCiE as the reciprocal so users do not add or average the values.
How to calculate each metric correctly
1. Define the reporting boundary
Write down which electrical systems and spaces belong to the data-center boundary before collecting numbers. The boundary may include the IT rooms, power-distribution equipment, chillers, pumps, air handlers, lighting and control systems. If offices, manufacturing areas or shared central-utility systems are included, allocate their energy consistently and explain the allocation.
2. Use the same continuous 12-month period
The numerator and denominator must cover the same continuous 12 months. Matching periods prevents seasonal cooling loads, maintenance shutdowns or partial occupancy from distorting the ratio. A monthly PUE trend can be useful for operations, but the standardized annual figure should be calculated from the complete matching period rather than from unrelated monthly samples.
3. Measure total facility energy
Collect utility and submeter data for every energy source inside the declared boundary. DOE guidance identifies cooling, lighting and supporting infrastructure as facility energy that belongs in the data-center total. Convert electricity and any other included energy streams to a consistent unit before adding them. Document whether generation losses, renewable systems, district cooling or shared services are inside or outside the accounting boundary.
Crashes, No Sound, or Screen Glitches?
Random freezes, missing sound and display glitches usually trace back to one bad driver. Find and replace yours safely.Free scan · under a minutePC Slower Than It Used to Be?
A free scan shows the junk files, broken settings and background clutter dragging Windows down - then fixes them in one click.Free scan · Windows 10 & 114. Measure IT-equipment energy
The denominator should represent energy consumed by the IT load, not merely the capacity rating of the UPS or the nameplate ratings of servers. Historical DOE task-force guidance recommended measuring at least at the UPS output, with direct measurement at the IT loads as a progressive goal. Apply the current ISO measurement categories and state the exact point used in the report.
5. Divide, validate and publish the method
Sum the two 12-month energy series, calculate PUE, then derive DCiE only if needed. Keep the raw meter data, calibration records, interval settings, missing-data treatment and allocation worksheets. A number without this method statement cannot be meaningfully compared with another site’s number.
Worked example with hypothetical data
Assume a facility’s declared boundary records 12,000 MWh of total energy over one continuous year. IT meters record 8,000 MWh for the same period. These figures are illustrative arithmetic, not an industry benchmark.
Rank #3

- BQHHWTZ AMC16Z-FAK Multi-Channel AC/DC Energy Meter for 1Phase 3Phase System with RS485 Modbus-RTU
- Calculate PUE: 12,000 ÷ 8,000 = 1.50.
- Calculate DCiE: (8,000 ÷ 12,000) × 100% = 66.7% when rounded to one decimal place.
- Check the reciprocal: 1 ÷ 1.50 × 100% = 66.7%.
The result says that the facility used 1.50 units of total data-center energy for each unit delivered to IT equipment during that defined year. It does not say whether the servers performed more useful work than another facility, whether the electricity was renewable, or how much water the cooling system consumed.
Measurement categories and boundaries determine comparability
Two facilities can report different PUE values even when their cooling technology is similar if they draw their boundaries differently or measure IT energy at different points. ISO/IEC 30134-2:2026 introduces measurement categories and reporting rules to make those choices explicit. A report should identify the category, meter locations, included systems and treatment of shared infrastructure.
Common boundary questions to answer
- Does the total include only the data-center building, or also a shared utility plant?
- Are offices, workshops or network rooms outside the data-center area excluded or allocated?
- Are on-site generators, photovoltaic systems, batteries and conversion losses counted, and at which point?
- Is IT energy measured at the UPS output, at a power-distribution unit, or at individual racks and devices?
- How are unavailable intervals, estimated readings and meter failures handled?
- Are the numerator and denominator based on identical timestamps and the same 12-month dates?
When a published value omits these details, treat it as a claim about that organization’s reporting method, not as a directly comparable performance ranking.
What ISO/IEC 30134-2:2026 does—and does not—promise
The standard establishes a common KPI method; it does not set a universal target or pass/fail threshold. Its scope explicitly states: “The ISO/IEC 30134 series does not specify limits or targets for any KPI and does not describe or imply, unless specifically stated, any form of aggregation of individual KPIs into a combined nor an overall KPI for data centre resource usage effectiveness or efficiency.”
Consequently, there is no ISO-defined “good PUE” number that applies to every climate, workload, facility age or measurement category. A value that is appropriate for one operating context may not be attainable or meaningful in another. Set internal targets only after establishing a consistent baseline, documenting the boundary and considering reliability and workload requirements.
PUE is not a complete sustainability or productivity score
PUE focuses on infrastructure energy overhead. It does not show how effectively the IT equipment converts energy into useful computation, storage transactions or delivered services. A lightly utilized server room can have an attractive PUE while wasting energy on idle equipment; a high-performance computing site may have a different infrastructure ratio because of its cooling and power requirements.
DOE recommends evaluating data centers with multiple energy and sustainability metrics, including water and carbon. Depending on the decision, pair PUE with measures such as water use, carbon intensity, renewable-energy accounting, IT utilization, service output, availability and embodied impacts. Keep those metrics separate rather than combining them into a homemade “overall efficiency” score.
Rank #4

- 1.Digital Multimeter:This power energy meter can measure and display voltage current active power energy frequency and power factor at the same time.with split current transformer,more convenient to install
- 2.Overload Alarm function:Backlight and power will flash simultaneously to give an alarm when exceeding the preset value.You can preset power limit by yourself
- 3.Automatic Data Storage Function:The last test data is stored automatically when the power supply abruptly lose. Don't worry about data loss due to sudden power outages
- 4.One-touch Control:The button can be used to control the backlight,reset energy, preset power alarm limit
- 5.LCD Display:Large-screen LCD with all sight 180° view,The blue backlight can be turned on/off manually. PZEM-022 requires an external power supply to light up the screen
Building the metering system needed for credible PUE
Metering is an implementation category, not a shortcut to a favorable number. DOE materials describe metering as necessary to supply data for performance metrics and discuss granular electrical and environmental measurements. A DOE case study used electrical meters, temperature sensors and flow meters to calculate PUE in real time.
Plan the measurement points
- Draw a one-line diagram of the electrical distribution system and mark the selected facility and IT measurement points.
- List every feeder, panel, UPS, power-distribution unit and shared service that enters the boundary.
- Choose interval resolution and data retention that support annual totals and operational diagnostics.
- Specify voltage, current, power, energy, power factor and communications requirements for each meter.
- Define calibration, time synchronization, validation checks and procedures for missing data.
Choosing a three-phase power meter
A search for “three phase power meter” describes a broad category of facility equipment, not a plug-in consumer accessory. Suitability depends on the electrical system, phase configuration, voltage, current-transformer ratio, conductor arrangement, isolation requirements, accuracy class, communications protocol, enclosure and installation rules. A meter installed on the wrong side of a transformer or with an incorrectly sized current transformer can produce a precise-looking but unusable result.
Recommended Free Tools
Have a qualified electrical professional verify compatibility, safe access, protection, commissioning and local code requirements. Record the meter serial number, transformer ratios, firmware, calibration date and installation location. For critical facilities, design maintenance bypasses and alarm handling so that metering work does not compromise power availability.
Connect meters to a usable data system
Store readings in a system that preserves raw intervals as well as aggregated totals. Trend energy with temperature, airflow, chilled-water flow and IT load so operators can identify whether a change in PUE came from cooling, distribution losses, occupancy or a measurement fault. Access controls and an audit trail help distinguish a real operational change from an edited value.
Independent reader supportYour contribution helps us test, update, and keep practical guides available for everyone.Common calculation and reporting mistakes
Mixing periods
Using a summer facility total with a fiscal-year IT denominator invalidates the ratio. Align timestamps first, then calculate.
Changing the boundary without restating history
Adding a shared chiller plant or excluding a network room changes the numerator. Mark the boundary change and avoid presenting the new series as a like-for-like trend unless historical data is recalculated.
Free tools Windows power users keep installed
One-click scans. No signup required.
Counting capacity instead of energy
UPS ratings, rack capacity and server nameplates are not IT energy consumption. Use meter readings at the declared measurement point.
Best Value
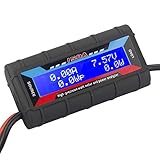
- Bright blue backlit LCD display, easy reading. 12 gauge wire take higher volt and current. It is indispensable for analyzing, testing and troubleshooting any DIY DC power project. Very accurate in giving DC volt, ampere and wattage
- Operates from 4.8V to 60V or 0V to 60V with optional auxiliary battery. Measures 0-150A, resolution 0.01A; Measures 0-60V, resolution 0.01V; Measures 0-6554W, resolution 0.1W; Measures 0-65Ah, resolution 0.001Ah; Measures 0-6554Wh, resolution 0.01Wh
- Measuring Current (A), Voltage (V), Watts (W), Amp-hours (Ah), Watt-hours (Wh), Peak Amps (Ap), Minimum Volts (Vm), Peak Watts (Wp). Widely application battery tester, can test Solar Power batteries and chargers
- Multifunctional Tester: Evaluate RC battery charging efficiency.Measure power and energy consumption of any battery powered device. Predict model airplane flight time,Choose the best propeller/most efficient motor .Check for wiring and connector power loss.Ensure peak currents are safe for motor, ESC & Battery as well as wiring and connectors
- Notice: This watt meter was designed to be safe in systems unsing less than 60V and carrying current up to 150A. DO NOT EXCEED THE LIMITES
Double-counting conversion stages
Ensure that energy measured at an upstream switchboard is not added again after it appears at a downstream UPS or distribution panel. Map every meter to the electrical one-line diagram.
Rounding too early
Calculate from unrounded energy totals and round only the final PUE or DCiE display. Early rounding can create a visible mismatch between the two reported values.
Comparing unexplained values
A single PUE number without category, boundary, period and meter location is not a fair comparison. Request the method statement before drawing conclusions.
Quick wins for a faster PC:
Repair Windows errors before they cause bigger problemsFix Now →Scan for outdated or missing drivers - takes under a minuteDriver Scan →Clear out junk files and repair common Windows errorsFree Scan →How to present PUE and DCiE in a report
Use one primary line that follows the standard, then provide the reciprocal for accessibility:
Annual PUE: 1.50, calculated for the declared data-center boundary from January–December 2026 using the stated ISO measurement category.
Equivalent DCiE: 66.7% (reciprocal of the reported PUE).
Attach a methods note containing the boundary diagram, meter locations, continuous 12-month dates, energy units, data-quality checks, estimated intervals, allocation rules and rounding convention. For month-by-month operations, show the monthly trend separately from the standardized annual KPI.
Which metric fits each audience?
| Audience or task | Recommended presentation | Reason |
|---|---|---|
| Regulatory, investor or sustainability report | PUE first; DCiE optional | PUE aligns with ISO/IEC 30134-2:2026 terminology and reporting structure. |
| Facilities engineering team | PUE with detailed submeter trends | The ratio connects directly to cooling, distribution and IT-load investigations. |
| Executive or public explanation | PUE plus the equivalent DCiE percentage | The percentage can be easier to read without changing the underlying result. |
| Vendor or site-to-site comparison | Compare PUE only after matching boundary, category, period and operating context | Unstated accounting differences can overwhelm the apparent numerical difference. |
| Energy or sustainability strategy | PUE alongside water, carbon and useful-output metrics | PUE alone cannot describe total environmental impact or computing productivity. |
Decision checklist
- Use PUE as the headline KPI when you need alignment with the current ISO standard.
- Add DCiE when readers benefit from a percentage, and label it as the reciprocal.
- Use the same continuous 12-month period for total facility and IT energy.
- State the measurement category, boundary, meter locations and allocation rules.
- Do not call a value a universal target; ISO/IEC 30134-2:2026 sets no limits or cutoffs.
- Do not use PUE or DCiE as a proxy for carbon, water, utilization or useful computing output.
- For procurement, evaluate the metering system’s scope, measurement points, accuracy, logging, communications, compatibility, calibration and installation requirements.
Bottom line
PUE is the metric to use for standardized evaluation and reporting because ISO/IEC 30134-2:2026 defines its calculation and reporting framework. DCiE is a convenient percentage translation, not a competing KPI. Whichever value you publish, the boundary, measurement category and matching 12-month period are as important as the number itself.
Quick Recap
Product prices and availability are accurate as of the date/time indicated and are subject to change. Any price and availability information displayed on Amazon at the time of purchase will apply.

