There is no universal winner between NVIDIA Vera, AMD EPYC and Intel Xeon. Choose by matching the processor and complete server configuration to your software, memory footprint, accelerator topology, power limit and operating cost. Vera is an Arm-compatible NVIDIA CPU designed around high-bandwidth LPDDR5X memory and coherent links to NVIDIA GPUs. EPYC and Xeon are x86 server families with different generations and platforms. Core counts or a single vendor multiplier cannot establish which system will deliver the best throughput, latency or rack economics for your workload.
What you are comparing
These names represent processor families and, in Vera’s case, a platform strategy rather than interchangeable socketed parts. NVIDIA describes Vera as an Arm-compatible CPU with 88 custom Olympus cores. Its NVIDIA Spatial Multithreading implementation can expose up to 176 threads, but its partitioned resources should not be assumed to behave like conventional x86 simultaneous multithreading. The published design targets agentic AI, reinforcement learning, analytics, data processing and HPC systems. See the NVIDIA Vera CPU specifications and NVIDIA’s architecture discussion.
As an Amazon Associate I earn from qualifying purchases.
AMD EPYC and Intel Xeon are x86-64 server processor lines. A family name does not identify one performance level: generation, model, socket count, memory population, firmware, accelerators and power configuration all change the result. The official material considered here does not establish a current, like-for-like Xeon 6 specification table, so Xeon capacity, I/O and power numbers must be taken from the exact Intel model and server quote rather than inferred from “Xeon” as a category.
| Dimension | NVIDIA Vera | AMD EPYC | Intel Xeon |
|---|---|---|---|
| Instruction-set path | Arm-compatible, NVIDIA custom Olympus core; NVIDIA identifies Arm v9.2 compatibility. | x86 server family; confirm the exact EPYC generation and platform. | x86 server family; confirm the exact Xeon generation and platform. |
| Published core/thread figure | 88 cores; up to 176 threads through NVIDIA Spatial Multithreading. | Varies by model; no single family-wide count is meaningful. | Varies by model; no single family-wide count is meaningful. |
| Memory figure available in the cited material | Up to 1.2 TB/s LPDDR5X bandwidth and up to 1.5 TB capacity, vendor product figures. | Depends on model, DIMM population and server design. | Depends on model, DIMM population and server design; current values are not established by the cited material. |
| CPU–GPU fabric | NVIDIA describes up to 1.8 TB/s coherent NVLink-C2C bandwidth with NVIDIA GPUs. | Evaluate the specific PCIe, CXL, GPU and interconnect topology. | Evaluate the specific PCIe, CXL, GPU and interconnect topology. |
| Best-supported conclusion | Potentially attractive when Arm software and tightly coupled NVIDIA GPU access fit the application. | Potentially attractive where x86 compatibility and high rack throughput fit the application. | Potentially attractive where the selected Xeon platform, software ecosystem and service terms fit. |
The numbers in the Vera column are NVIDIA’s published product claims, not independent measurements. The EPYC and Xeon columns deliberately avoid family-wide assumptions.
#1 Best Overall

- Enhanced airflow for reliable cooling of 600W GPUs and accelerator cards
- 4U Rackmount with 3+1, 80-PLUS Titanium, 2700W CRPS
- Dual Socket SP5 (LGA 6096), supports AMD EPYC 9005/9004 (with AMD 3D V-Cache Technology) and 97x4 series processors
- 12+12 DIMM slots (1DPC), supports DDR5 RDIMM, RDIMM-3DS
- 4 hot-swap 2.5" NVMe (PCIe5.0 x4) drive bays, 20 Hot-swap 2.5" SATA drive bays
Start with the workload, not the brand
Write down the production path before looking at benchmark charts. A database with strict tail-latency targets, a compiler farm, a Java service, an ETL pipeline, an agent sandbox and a GPU-host orchestration tier stress different parts of a server.
Identify the dominant work
- CPU-bound application: establish single-thread latency, sustained all-core throughput and the fraction of work that can run concurrently.
- Memory-bound application: measure working-set size, sustained bandwidth, random-access latency and NUMA behavior. Aggregate bandwidth is not the same as bandwidth available to each core.
- GPU-connected workload: map data movement, synchronization and host-side orchestration. Coherent CPU–GPU access can matter more than a headline CPU core count.
- Service or database: capture requests per second, p95/p99 latency, lock contention, storage and network behavior under realistic concurrency.
- Build, scripting or analytics pipeline: include compiler versions, interpreter or runtime, compression, serialization and I/O because these can dominate the CPU stage.
Define the comparison unit
Decide whether you need per-core speed, one-socket throughput, a server’s throughput per watt or throughput for a complete rack power envelope. A processor that wins a single-thread test can lose a rack-level comparison after memory, cooling and node count are included. Conversely, a high-throughput server may be a poor choice when one latency-sensitive thread gates the application.
Architecture and software compatibility
Vera’s Arm compatibility is a first-order buying decision. Before ordering, verify that the operating system image, application binaries, container base images, language runtimes, cryptography and math libraries, observability agents and backup tools have Arm builds. Check whether suppliers provide certification and support for the exact Vera platform. NVIDIA’s description of Arm v9.2 compatibility is available in its technical blog.
Recommended Free Tools
Do not assume that a container makes an x86 application portable. A container still contains architecture-specific binaries and native extensions. A source rebuild may be straightforward for a portable C++, Go or Java service, while proprietary plugins, binary-only drivers or unmaintained dependencies can block migration. Test installation, compilation, startup, failover and upgrade procedures, not just a steady-state benchmark.
EPYC and Xeon provide established x86-64 deployment paths, but “x86 support” is not a substitute for checking the exact generation. Confirm instruction-set extensions, hypervisor support, kernel requirements, firmware, vendor-certified operating systems and any licensing tied to sockets or cores.
Use a compatibility gate
- Inventory every executable, shared library, container image and device driver in the production path.
- Obtain Arm and x86 support statements from each software vendor, including supported operating-system releases and compiler/runtime versions.
- Build a clean test image for the proposed server architecture; do not benchmark an emulated or translation layer and call it native performance.
- Run functional, failover and upgrade tests before performance testing.
- Record any unsupported component and the engineering or licensing cost of replacing it.
Core and thread performance: why counts mislead
Vera’s 88 cores and up to 176 Spatial Multithreading threads are useful capacity indicators, not a throughput guarantee. NVIDIA says spatial multithreading exposes threads with partitioned resources; a pair of threads therefore should not be scored as two fully independent conventional cores. Measure the application at the concurrency levels it will actually use, including queueing and tail latency.
For EPYC and Xeon, compare the exact model’s core count, frequency behavior, cache hierarchy, instruction extensions and simultaneous-multithreading policy. A lower-count processor with stronger per-thread performance can beat a larger chip on serial or lightly parallel code. A higher-count part can win a well-parallelized batch workload but lose when memory or power limits throttle it.
Do these 3 things before closing this tab:
1Fix the driver behind crashes, sound loss and screen glitches2Repair Windows errors before they cause bigger problems3Scan for outdated or missing drivers - takes under a minuteMeasurements to collect
- Single-thread and lightly threaded latency for the critical request or task.
- Sustained throughput at realistic concurrency, including p95 and p99 latency.
- Scaling efficiency as worker count rises toward the socket limit.
- CPU utilization, frequency, cache misses, memory stalls and context switching.
- Performance while the network, storage and GPU paths are active.
Memory capacity, bandwidth and serviceability
NVIDIA specifies up to 1.2 TB/s of LPDDR5X memory bandwidth and up to 1.5 TB of capacity for Vera. Those are vendor product figures, not independently reproduced measurements. NVIDIA also describes serviceable SOCAMM memory modules. Confirm the capacity delivered in the server configuration, the number and type of modules, ECC and RAS behavior, replacement procedure and whether capacity can be expanded after deployment.
For every candidate, record usable capacity after firmware reservations, sustained application bandwidth, latency, channel population and memory power. Compare like denominators: socket bandwidth, node bandwidth and bandwidth per active core answer different questions. A bandwidth number measured with streaming reads will not predict a random-access database workload.
| Memory question | Why it changes the decision |
|---|---|
| Does the working set fit? | Spilling to another tier can overwhelm any CPU advantage. |
| What is sustained bandwidth under the real access pattern? | Read/write mix, locality and concurrency can make application bandwidth far below the headline. |
| What are ECC, RAS and recovery options? | Reliability requirements may outweigh peak bandwidth. |
| Can capacity be replaced or expanded? | Serviceable modules and future expansion affect downtime and lifecycle cost. |
| How much power does memory consume? | Memory power belongs in the server and rack energy budget, not just the CPU line item. |
I/O, accelerators and coherent links
For AI and data-processing systems, the path between CPU memory, GPUs, NICs and storage can dominate. NVIDIA describes up to 1.8 TB/s of coherent NVLink-C2C bandwidth between Vera and NVIDIA GPUs. That figure applies to the described NVIDIA platform and is not a generic replacement for measuring application data movement. Validate GPU count, topology, address-space behavior, synchronization overhead, NIC placement and the software stack on the exact system.
For an EPYC or Xeon server, obtain the platform’s PCIe and CXL topology, lane allocation, switch configuration, GPU support, network-adapter placement and storage layout. The processor name alone does not tell you whether a device is attached to the desired socket or sharing a bottleneck. Draw the topology and run a transfer test with the same GPU, NIC and storage devices used in production.
Quick wins for a faster PC:
Clear out junk files and repair common Windows errorsFree Scan →Fix the driver behind crashes, sound loss and screen glitchesFind Drivers →Power, cooling and rack density
Compare processor power references on the same basis and then add memory, accelerators, fans, voltage-regulator losses, networking, storage and chassis overhead. A CPU’s nominal power is not the rack’s operating power. Measure at the wall or use a documented server power model at the intended utilization, ambient temperature and cooling mode.
Rank #2
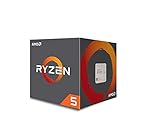
- Frequency: 3.4 ghz precision boost
- 4 cores/8 threads unlocked; Pci express version : pcie 3.0 x16; Max boost clock : 3.4ghz
- Cache: 2 mb / 8 mb (l2/l3)
- Socket type: am4;virtualization
- Thermal solution: Wraith stealth cooler and max temprature 95 degree celcius
Rack density is a throughput-per-power question. If a server delivers twice the work but consumes more than twice the facility power, it may be worse economically. Include cooling capacity, breaker limits, rack airflow and service clearances. For latency-sensitive services, also test performance when the system is thermally steady rather than immediately after startup.
What the public comparisons actually show
NVIDIA’s Vera product material claims up to 1.8× performance over x86 CPUs across three named agentic-AI workloads. The same material describes up to 2× memory bandwidth and 3× bandwidth per core versus its stated x86 baseline. These are NVIDIA measurements against a vendor-defined baseline, not a neutral ranking of all EPYC and Xeon systems; read the product page for the stated conditions.
NVIDIA’s technical blog discusses up to 1.5× sandbox performance under full-socket load and presents additional comparisons involving compilers, scripting, runtime engines, ETL and analytics. Because the workloads and claim framing differ, those multipliers must remain tied to their individual tests rather than combined into one general Vera advantage.
PC Slower Than It Used to Be?
A free scan shows the junk files, broken settings and background clutter dragging Windows down - then fixes them in one click.Free scan · Windows 10 & 11Outdated Drivers Are Slowing You Down
One free scan finds every outdated or missing driver and matches the right update for your exact hardware.Free scan · exact hardware matchNVIDIA’s launch announcement includes partner statements, which are useful examples of reported deployments but not independent benchmark reports. Michael Truell, cofounder and CEO of Cursor, said: “We’re excited to use NVIDIA Vera CPUs to improve overall throughput and efficiency so we can deliver faster, more responsive coding agent experiences for our customers.” Alex Gallego, founder and CEO of Redpanda, said its testing of Apache Kafka-compatible workloads saw “up to 5.5x lower latency.” Both statements are hosted by NVIDIA and should be treated as customer endorsements with no published matched-system methodology in the announcement. See the March 16, 2026 launch announcement.
AMD’s modeled 100 kW rack scenario
AMD’s rack-throughput article and its Performance Projections Methodology model node counts and performance within a 100 kW rack limit. The normalized geometric-mean results are AMD’s projections across selected workloads; some single-node values are estimates, and the exercise is not an independently reproduced three-way test.
| Configuration in AMD’s model | Normalized rack throughput | How to read it |
|---|---|---|
| NVIDIA Vera baseline | 1.00 | AMD’s modeled reference under its stated 100 kW assumptions. |
| Intel Xeon 6980P | 1.46 | AMD’s modeled result for that selected Xeon configuration. |
| AMD EPYC 9965 (Turin) | 2.37 | AMD says it delivers an estimated 2.37× the rack-level throughput of its Vera baseline in this scenario. |
| Projected AMD EPYC Venice | 3.30 | Projected, not a measured shipping-system result. |
These values answer a narrow question—modeled throughput under AMD’s chosen workload mix, node designs and 100 kW boundary. They do not establish that one processor wins every application, price point or deployment.
Independent reader supportYour contribution helps us test, update, and keep practical guides available for everyone.A repeatable comparison procedure
- Freeze the workload definition. Select representative production traces or datasets, concurrency, service-level objectives and batch duration.
- Choose complete systems. Match socket count, memory capacity, accelerator model, NICs, storage, firmware and cooling assumptions as closely as possible.
- Pass the software gate. Verify native Arm or x86 binaries, libraries, containers, drivers, hypervisor and support commitments.
- Measure performance. Capture throughput, single-thread latency, p95/p99 latency, scaling, memory bandwidth and CPU utilization.
- Measure power. Record idle, steady-state and peak wall power for the whole server, then calculate useful work per kWh.
- Exercise failure and maintenance paths. Test reboot, node loss, memory replacement, firmware updates, GPU recovery and workload rescheduling.
- Model the rack. Apply node count, network fabric, storage, cooling, breaker and floor-space limits; include expected utilization rather than nameplate-only power.
- Calculate three-year cost. Request quotes for CPU, memory, chassis, accelerators, networking, support, software licensing, electricity and cooling. Keep one-time purchase and recurring operating costs separate.
- Run sensitivity checks. Recalculate the decision for lower utilization, memory expansion, power-price changes, software-porting effort and a different workload mix.
Which platform fits which situation?
Choose Vera for a qualified Arm-and-NVIDIA design
Vera deserves consideration when the application has a supported Arm software path, benefits from the specified LPDDR5X bandwidth or capacity, and moves substantial data between CPU and NVIDIA GPUs. The decision still requires testing the exact server and GPU topology; the published bandwidth figures do not guarantee application speed.
Choose EPYC when x86 throughput and rack economics lead
An EPYC system is a candidate when existing x86 software, the selected model’s memory and I/O configuration, and the rack power budget align with the workload. AMD’s 100 kW projection can inform a hypothesis, but validate it with your own traces and a quoted system. AMD’s EPYC server-processor information is a starting point for identifying the exact family; it is not a substitute for platform validation.
Choose Xeon only after specifying the exact model
Xeon remains an x86 option, but a family-level label cannot answer questions about cores, memory, I/O or power. Obtain the current model specification, server configuration, software certifications and support terms, then test it under the same conditions as Vera and EPYC. The cited evidence here does not provide a neutral current Xeon specification or price comparison.
Cost, availability and procurement checks
No like-for-like street prices, independently confirmed marketplace availability or shipping dates are established in the cited material. Ask suppliers for a complete bill of materials and delivery commitment rather than comparing processor list prices.
- CPU or system model, socket count and warranty.
- Installed and maximum usable memory, module type and replacement policy.
- GPU, NIC, storage and interconnect topology.
- Firmware, operating-system and hypervisor support for the required architecture.
- Support response times, spare parts and lifecycle policy.
- Measured or modeled server power, cooling requirement and rack density.
- Porting, testing and software-license costs.
A processor is not a drop-in consumer upgrade. Even a listing described as an AMD EPYC server CPU must be matched to a compatible motherboard, firmware, memory, chassis and service plan.
Common comparison mistakes
- Ranking by core count: correct by measuring the application’s serial fraction, scaling and tail latency.
- Blending vendor multipliers: keep each claim attached to its workload, baseline and measurement method.
- Comparing bandwidth labels alone: include capacity, latency, access pattern, ECC/RAS and memory power.
- Ignoring software migration: price porting, certification and operational risk before selecting an Arm system.
- Using a CPU-only test for a GPU system: reproduce the complete data path, including coherent transfers and synchronization.
- Treating a modeled rack result as a lab benchmark: label AMD’s 100 kW figures as projections and test equivalent systems.
- Leaving out facility costs: include cooling, networking, storage, floor space and electricity in the total-cost model.
Decision rule
Select the platform that passes software compatibility, meets the application’s latency and throughput targets, fits the memory and accelerator topology, and delivers the required work within the site’s power and budget limits. Vera is not automatically a replacement for EPYC or Xeon; EPYC and Xeon are not automatically better because they are x86. A fair decision comes from matched, full-system measurements and a transparent rack-and-lifecycle model.
Quick Recap
Product prices and availability are accurate as of the date/time indicated and are subject to change. Any price and availability information displayed on Amazon at the time of purchase will apply.

