Nintendo stock and Sony stock represent different kinds of exposure. Nintendo describes itself as a single-segment home-entertainment company built around dedicated game platforms, software and intellectual property. Sony reports a portfolio of continuing businesses spanning games and network services, music, pictures, entertainment technology and image sensors. That structural difference can affect how investors interpret growth, concentration, cyclicality and risk, but it does not establish that either stock is the better investment.
The comparison below uses Nintendo’s fiscal-year 2025 business description (year ended March 31, 2025) and Sony’s fiscal-year 2026 continuing-operations segment data (year ended March 31, 2026). Those are not identical reporting periods, so the figures should not be treated as a same-year performance contest.
As an Amazon Associate I earn from qualifying purchases.
Quick comparison: what each share represents
| Question | Nintendo | Sony |
|---|---|---|
| Reported structure | One business segment | Multiple continuing reportable segments |
| Core exposure | Dedicated video game platforms, software and Nintendo-linked intellectual property | Games and network services, music, pictures, entertainment technology and image sensors |
| Business description period used here | Fiscal year ended March 31, 2025 | Fiscal year ended March 31, 2026 |
| Primary Japanese listing | Tokyo Stock Exchange Prime Market, code 7974 | Tokyo Stock Exchange ordinary shares |
| U.S. trading structure | Japanese-listed shares; the cited status information does not establish a U.S. ADR | NYSE ADR ticker SONY; one ADR represents one ordinary share |
| Share unit detail | One trading unit is 100 shares | ADR ratio is one ADR to one ordinary share |
In plain language, buying Nintendo gives a relatively concentrated claim on one game-led entertainment system. Buying Sony gives exposure to a group whose game business is important but sits alongside several other creative and technology operations.
The Tool Desk
Outbyte Driver Updater FREEScan for outdated or missing drivers - takes under a minuteDriver Scan →Outbyte PC Repair FREEClear out junk files and repair common Windows errorsFree Scan →What Nintendo’s business includes
A single home-entertainment segment
Nintendo’s fiscal 2025 annual report describes a home-entertainment business that primarily develops, manufactures and sells entertainment products. It defines dedicated video game platforms as handheld and home-console hardware and software. The same description identifies character merchandise and playing cards as major products, and it discusses using Nintendo intellectual property in visual content and mobile applications.
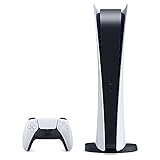
#1 Best Overall

- Model Number CFI-2000
- Includes DualSense Wireless Controller, 1TB SSD, 2 Horizontal Stand Feet, HDMI Cable, AC power cord, USB cable, printed materials, ASTRO’s PLAYROOM (Pre-installed game)
- Vertical Stand sold seperately
Nintendo reports the company as operating in a single business segment. That is an accounting and management-reporting boundary, not a claim that every product is identical. Hardware, first-party software, licensing, visual content and mobile applications can have different economics, but Nintendo does not present them as separate reportable segments in the cited annual report. A comparison that invents separate Nintendo segments would therefore imply a level of disclosure the company does not provide.
Why the platform relationship matters
Nintendo’s model links hardware, software and characters. A dedicated platform creates the installed base on which Nintendo can sell games and related content. Software and characters can also extend beyond the console through merchandise, visual content and mobile applications. This creates a unified intellectual-property ecosystem rather than a portfolio of unrelated industries.
The concentration is useful to understand in both directions. Successful hardware adoption can support software sales and increase the value of Nintendo characters across more formats. Conversely, a weak platform cycle, delayed hardware transition or underperforming software slate can affect several parts of the ecosystem at once. The cited material does not provide a forecast for any particular console cycle, so the point is about business sensitivity, not a prediction.
Do these 3 things before closing this tab:
1Fix the driver behind crashes, sound loss and screen glitches2Clear out junk files and repair common Windows errors3Scan for outdated or missing drivers - takes under a minuteCapital allocation and liquidity policy
Nintendo’s business policy says it internally provides capital for future growth and seeks to maintain a strong, liquid financial position. It describes retained earnings as funding research into new technology, new-product development, capital investment, securing materials, marketing and selling capabilities, and potential share buybacks.
“As an entertainment company that creates smiles, Nintendo Co., Ltd. ("the Company") and its consolidated subsidiaries (together with the Company, "Nintendo") strive to introduce new forms of entertainment while maintaining a robust corporate management.”
That statement describes a policy framework, not a guarantee that a particular project, buyback or balance-sheet level will occur.
How Nintendo describes its dividend
Nintendo’s stated annual dividend policy sets dividend per share at the higher of two calculations: one based on 40% of consolidated operating profit and another based on 60% of consolidated profit. The policy includes share-count and rounding mechanics, and the page notes a transition affecting the interim dividend for the fiscal year ending March 2026.
This is a formula-based policy, not a fixed dividend yield. The eventual yen amount can change as profit, operating profit and the relevant share count change. An investor must also distinguish the policy formula from the dividend actually declared for a given year.
What Sony’s continuing businesses include
Game & Network Services
Sony’s Game & Network Services segment covers digital software, add-on content, network services and home-gaming products. It is the part of Sony most closely associated with PlayStation, but it is only one of the group’s continuing reportable segments.
Music
The Music segment includes recorded music, music publishing, visual media and platform activities. Its economics can be influenced by catalogs, licensing, publishing rights, releases and the distribution platforms through which audiences consume music.
Pictures
Pictures includes motion pictures, television production and media networks. Film and television projects can have different release schedules and revenue timing from games, while media networks add another form of entertainment exposure.
Entertainment, Technology & Services
Entertainment, Technology & Services includes imaging, sound, network services and displays. This segment gives Sony exposure to consumer and professional technology activities that are distinct from game software, music rights and film production.
Imaging & Sensing Solutions
Imaging & Sensing Solutions is Sony’s image-sensor business. Image sensors connect Sony to equipment makers and device markets rather than only to consumers buying Sony-branded entertainment products.
Rank #2
- CPU: x86-64-AMD Ryzen Zen 8 Cores / 16 Threads at 3.5GHz.GPU: AMD Radeon RDNA 2-based graphics engine.
- 16GB GDDR6/256-bit Memory; 825GB SSD Storage Capacity
- Ethernet (10BASE-T, 100BASE-TX, 1000BASE-T), IEEE 802.11 a/b/g/n/ac/ax, Bluetooth 5.1
- HDR technology, 8K output, 4K TV gaming, Up to 120 fps with 120Hz output, Tempest 3D AudioTech
- What's Included: Sony PlayStation 5 Disc Version; Wireless controller; USB cable, HDMI cable, AC power cord. Nogtox PVT HDMI_cable
All Other and group management
Sony also reports an All Other category. At the group level, Sony describes its headquarters as responsible for overall management, portfolio management and capital allocation. That structure makes Sony’s corporate center part of how the group allocates resources among businesses with different markets and investment needs.
Sony FY2026 continuing-operations sales by segment
The following figures are Sony-reported sales in yen millions for the fiscal year ended March 31, 2026. They are sales, not operating profit, net income or cash flow.
Recommended Free Tools
| Continuing segment | FY2026 sales (¥ millions) | What the segment covers |
|---|---|---|
| Game & Network Services | ¥4,685,651 million | Digital software, add-on content, network services and home-gaming products |
| Music | ¥2,120,110 million | Recorded music, publishing, visual media and platform activities |
| Pictures | ¥1,499,290 million | Motion pictures, television production and media networks |
| Entertainment, Technology & Services | ¥2,260,532 million | Imaging, sound, network services and displays |
| Imaging & Sensing Solutions | ¥2,151,533 million | Image sensors |
| All Other | ¥89,072 million | Other activities reported by Sony |
| Consolidated continuing-operations total | ¥12,479,620 million | Total of Sony’s continuing operations |
The table shows why a Sony share cannot be analyzed as a PlayStation-only investment. Game & Network Services is the largest listed continuing segment in this report, but music, pictures, technology and sensing contribute separate sources of sales and separate operating conditions.
Financial Services is not part of this continuing-segment total
Sony’s fiscal 2026 Form 20-F classifies Financial Services as a discontinued operation in connection with a partial spin-off plan. It is therefore excluded from the continuing reportable segments and from the ¥12,479,620 million continuing-operations total above. Adding Financial Services to the current segment comparison would mix discontinued operations with the businesses Sony presents as continuing.
Why the two stocks create different business exposure
Concentration versus diversification
Nintendo’s one-segment reporting reflects a company centered on its own dedicated game platforms and intellectual property-led entertainment. Sony’s reporting shows a collection of businesses that span interactive entertainment, rights-based media, consumer technology and semiconductor components.
Concentration can make a company easier to understand, but it can also make a small number of strategic decisions more consequential. Product launches, platform adoption, software quality and the continuing appeal of Nintendo characters can influence much of Nintendo’s reported business at once.
Diversification can spread exposure across businesses with different demand cycles. A music catalog, film slate, image-sensor order pattern and game-network operation do not respond to exactly the same events. Diversification does not eliminate risk: it can make the group more complex to analyze, and weakness in one large segment can still affect consolidated results.
Different revenue engines
Nintendo’s revenue engines are tied to hardware and software for dedicated platforms, with additional monetization through character merchandise, playing cards, visual content and mobile applications. The platform and intellectual-property relationship is the central organizing idea.
Sony combines digital game software and network services with music rights, film and television production, media networks, imaging and sound products, displays and image sensors. The group therefore has both consumer-facing entertainment businesses and business-to-business technology exposure.
Different sensitivity to business cycles
A Nintendo investor generally needs to follow the company’s platform cycle and the ability of new software and characters to sustain engagement. A Sony investor needs to follow several cycles at once: game and network spending, music releases and rights, film and television performance, technology demand and image-sensor markets.
Free tools Windows power users keep installed
One-click scans. No signup required.
These are analytical questions rather than automatic advantages. A broader portfolio may reduce dependence on one product category, while a concentrated portfolio may provide clearer exposure to a particular entertainment thesis. The appropriate choice depends on the investor’s objectives, risk tolerance, valuation assumptions and time horizon.
The reporting periods are not aligned
The Nintendo operating description used here comes from the annual report for the fiscal year ended March 31, 2025. Nintendo’s investor-relations index now lists fiscal 2026 annual reporting, so anyone making a current numerical comparison should read that newer annual report and update Nintendo’s period-specific facts.
Sony’s segment sales in this article come from the fiscal year ended March 31, 2026 Form 20-F. Comparing those figures directly with Nintendo’s fiscal 2025 description would create a mixed-period analysis. Before comparing sales growth, margins, cash flow or earnings, use the latest full-year report for both companies and confirm that the fiscal periods match.
Rank #3

- 🚀 CPU: 3.5GHz, 8-core AMD Zen 2
- 🚀 Storage: Custom 825GB SSD
- 🚀 RAM: 16GB GDDR6
- 🚀 GPU: 10.3 teraflop RDNA 2 GPU
How the shares trade and what access means
Nintendo’s Japanese listing
Nintendo’s share-status information lists code 7974 on the Tokyo Stock Exchange Prime Market. One trading unit is 100 shares. The same status information reports 1,287,260,000 shares outstanding as of March 31, 2026.
The 100-share unit is a market-structure detail, not a statement of the total cost of a purchase. The yen share price, broker rules and any fractional-share facility determine what an individual investor can actually buy.
Sony’s ordinary shares and ADR
Sony’s ordinary shares are listed on the Tokyo Stock Exchange. In the United States, Sony’s New York Stock Exchange security trades as the ADR ticker SONY, and Sony states that each ADR represents one Sony ordinary share.
A one-for-one ADR ratio makes the share-count relationship straightforward, but it does not remove currency or market-structure considerations. The ADR price is quoted in U.S. dollars while the underlying ordinary share trades in Japan, so exchange rates and the relationship between the two markets affect quoted prices.
Practical issues for investors outside Japan
- Market access: Confirm whether your broker supports the Tokyo listing, the U.S. ADR or both.
- Currency: A Japanese-listed share is yen-denominated; an ADR is dollar-traded but still reflects the underlying company and exchange-rate movements.
- Fees: Brokerage commissions, foreign-exchange spreads, ADR fees and market-data charges vary by intermediary and are not established by the cited company filings.
- Taxes: Dividend withholding, capital-gains treatment and reporting obligations depend on your country of residence and account type.
- Trading hours and liquidity: Tokyo shares and a U.S. ADR trade in different sessions, and their bid-ask spreads may differ.
These details affect the experience of owning the shares, but the available company information does not provide a universal cost or tax comparison.
What’s actually slowing this PC down?
Pick the symptom - the matching free tool is one click away.
A disciplined way to compare Nintendo and Sony
- Set the comparison date. Use the latest annual reports for both companies, and record each fiscal year-end. Do not combine Nintendo FY2025 business facts with Sony FY2026 financial data as though they were contemporaneous.
- Map the reporting structure. Keep Nintendo as one reported segment unless a newer filing changes that presentation. For Sony, separate continuing operations from discontinued operations and retain the company’s own segment names.
- Separate sales from profits. Sony’s figures listed above are sales. To compare profitability, retrieve operating income, margins, net income and cash flow from the corresponding reports rather than inferring them from sales.
- Identify the economic drivers. For Nintendo, examine platform hardware, software, intellectual-property licensing and related entertainment. For Sony, examine each major segment’s demand, margins, rights exposure, capital needs and cycle.
- Review capital allocation independently. Nintendo publishes the internal-funding, liquidity and dividend framework described above. Do not assume Sony follows the same formula; use Sony’s current strategy and earnings materials for its own capital-allocation policy.
- Check the security you can actually buy. Decide between a Japanese listing and, where available, an ADR only after checking currency conversion, fees, tax treatment, trading hours and broker access.
- Analyze valuation separately. Price-to-earnings ratios, enterprise value, free-cash-flow yield, growth expectations and balance-sheet data change over time. None is supplied by the structural comparison here, and business breadth alone does not determine valuation.
Common mistakes in a Nintendo-versus-Sony comparison
Reducing Sony to PlayStation
PlayStation-related activity is represented in Game & Network Services, but Sony also reports music, pictures, entertainment technology and image sensors. A console-only comparison omits businesses that materially affect Sony’s consolidated results.
Inventing Nintendo segments
Nintendo’s cited annual report describes one business segment. It is reasonable to discuss hardware, software, merchandise and mobile activities as product or activity categories, but not to present them as separate reported segments without a newer filing that does so.
Adding discontinued Financial Services to Sony’s current total
Financial Services is classified as a discontinued operation in the fiscal 2026 Form 20-F because of the partial spin-off plan. It should not be added to the continuing-segment sales table.
Treating a dividend formula as a guaranteed yield
Nintendo’s formula determines a policy-based dividend calculation under stated conditions. It does not guarantee a constant percentage yield, because the share price and underlying profit figures change.
Quick wins for a faster PC:
Fix the driver behind crashes, sound loss and screen glitchesFind Drivers →Clear out junk files and repair common Windows errorsFree Scan →Scan for outdated or missing drivers - takes under a minuteDriver Scan →Assuming the same fiscal year
Nintendo’s detailed business description here is fiscal 2025, while Sony’s segment figures are fiscal 2026. Period alignment is essential before drawing conclusions about relative growth or performance.
Turning structure into an investment recommendation
A concentrated company can outperform or underperform a diversified company depending on execution, valuation, market conditions and investor timing. The portfolio descriptions explain exposure; they do not supply a price target, expected return or personalized recommendation.
What this comparison can and cannot tell you
It can tell you that Nintendo is organized around a single game-led entertainment business with substantial intellectual-property reach, while Sony is a multi-business group whose continuing operations include games, music, pictures, technology and image sensors. It can also clarify that Nintendo’s Japanese shares trade in 100-share units and that Sony offers a one-for-one U.S. ADR structure.
It cannot tell you which share is undervalued today, which company will deliver higher returns, how either stock will react to a future product launch, or what taxes and fees you will pay. Those questions require current prices, financial statements, forecasts, currency assumptions and personal circumstances.
PC Slower Than It Used to Be?
A free scan shows the junk files, broken settings and background clutter dragging Windows down - then fixes them in one click.Free scan · Windows 10 & 11Crashes, No Sound, or Screen Glitches?
Random freezes, missing sound and display glitches usually trace back to one bad driver. Find and replace yours safely.Free scan · under a minuteBottom line
Nintendo stock is the more concentrated exposure to a proprietary game-platform and character ecosystem. Sony stock is exposure to a broader portfolio in which games are combined with music, pictures, consumer and professional technology, and image sensors. Compare them as different business portfolios first, then evaluate valuation, reporting-period alignment, capital allocation and share-access costs before making any investment decision.
Quick Recap
Product prices and availability are accurate as of the date/time indicated and are subject to change. Any price and availability information displayed on Amazon at the time of purchase will apply.

