Free tools Windows power users keep installed
One-click scans. No signup required.
LLM observability must show more than whether an endpoint is reachable and returning successful responses. It needs to connect each request to the model, retrieval, tools, and policy decisions involved, then assess whether the result was grounded, useful, safe, and successful. Keep conventional monitoring for latency, errors, throughput, and infrastructure health; add workflow tracing and task-specific evaluation to understand what those service metrics cannot.
Why is traditional monitoring not enough for LLM applications?
Traditional application monitoring is good at answering operational questions: Is the service available? How long did a request take? Did it fail? How much traffic did it receive? Those signals remain essential, but they do not tell you whether a generated answer is supported by evidence, whether an agent completed its task, or whether a tool call was appropriate.
As an Amazon Associate I earn from qualifying purchases.
Generative systems can produce different outputs for similar inputs, and their behavior depends on context such as prompts, retrieved material, tool results, model routing, and guardrails. An HTTP 200 confirms that a request received a successful response at the service layer; it does not establish factual grounding, task completion, or policy compliance. Microsoft’s guidance puts the distinction plainly: “Uptime and error rates are not good indicators of quality and reliability in AI systems.”
The monitoring gap is therefore semantic and workflow-level, not a reason to discard application performance monitoring. Service health can look normal while the system retrieves irrelevant material, gives an unsupported answer, uses a tool incorrectly, or violates a safety expectation.
#1 Best Overall

- Professional AI & Creator Workstation: AMD Radeon AI PRO R9700 GPU with 32GB GDDR6 is engineered for AI development, professional content creation, and compute-intensive workloads.
- Massive 32GB Memory Capacity: 32GB of GDDR6 memory on a 256-bit bus provides ample bandwidth for large AI models, 8K video editing, and complex 3D rendering.
- Advanced RDNA 4 with AI Accelerators: 64 Compute Units with 3rd Gen Ray Tracing and dedicated 2nd Gen AI Accelerators for groundbreaking AI performance and visual computing.
- Professional Blower Cooling: Efficient single blower design exhausts heat directly out of the chassis, ideal for multi-GPU workstation and server configurations.
- Enterprise-Grade Thermal Solution: Vapor chamber heatsink with industrial Honeywell PTM7950 thermal interface material ensures reliable cooling under sustained professional loads.
What should you trace in an AI application or agent?
Build a correlated trace around the user request or agent run. The trace should make it possible to follow the execution path from the incoming request through the work that shaped the response, rather than treating the model call as one opaque event.
- Model calls: record the provider and model, prompt or template version, elapsed time, token counts, errors, and any retry or fallback that actually occurred.
- Retrieval: capture the search and reranking steps, along with provenance for the sources or chunks used. Avoid putting full retrieved text in broadly accessible telemetry by default.
- Tools and agent steps: record which tools were invoked, their outcomes, and the sequence of relevant agent actions. Include tool arguments or results only when justified by debugging needs and protected by appropriate controls.
- Policy decisions: record applicable guardrail or policy outcomes so an incident can be connected to the decision that allowed, blocked, or changed an action.
- Request linkage: connect these spans to the user-facing request or run, using identifiers that support investigation without unnecessarily exposing a person’s identity.
A useful trace should let an investigator answer which model and prompt version ran, what retrieval sources were used, which tools ran and with what outcome, where latency and token use accumulated, and what evaluation or policy result applied. That lineage can help narrow whether a regression followed a model, prompt, corpus, tool, or policy change.
Google Cloud’s agent observability documentation distinguishes logs for events and errors, metrics for latency and token usage, traces for execution paths, and prompt/response data for quality analysis. AWS’s Amazon OpenSearch Service documentation describes hierarchical traces for orchestration, model calls, tools, and retrieval. These are documented approaches, not independent comparative test results.
How do you monitor response quality and safety in production?
Pair operational measurements with evaluations tied to the task. At the service and step level, monitor latency, token consumption, errors, request volume, and tool-call volume or failures. Then assess whether the system is doing the right work, not merely completing it quickly.
- Retrieval-augmented answers: evaluate relevance and whether claims are grounded in retrieved material.
- Agents: assess tool-call correctness and task completion, including whether the chosen actions achieved the intended outcome.
- Safety controls: track relevant policy and safety outcomes, including blocked or escalated cases where those distinctions matter to the application.
Establish behavioral baselines and alert on meaningful changes. A change in quality score, tool failure rate, or retrieval relevance can matter even when request latency and HTTP error rates remain steady. Treat automated evaluator scores as diagnostic signals rather than ground truth: results depend on the evaluator, model, dataset, and task definition.
Rank #2

- ATTENTION BUYERS: EXPORTING this item outside the U.S. requires strict compliance with the Bureau of Industry and Security (BIS) U.S. Export Administration Regulations (EAR). Non-compliance carries fines up to $1 MILLION PER VIOLATION AND UP TO 20 YEARS IMPRISONMENT for both the buyer and seller. To uphold our regulatory obligations, we strictly follow BIS "Know Your Customer" guidance by screening each order and immediately aborting transactions showing unresolved regulatory red flags. ***
- [Double-Flow-Through Design] The RTX PRO 6000 Blackwell features a double-flow-through cooling design, optimizing efficiency and airflow to sustain peak performance under 600W power loads. | [5th Gen Tensor Cores] Deliver up to 3X the performance of the previous generation and support for FP4 precision for faster AI model processing times with reduced memory usage, enabling local fine-tuning of LLMs and generative AI | [4th Gen Ray Tracing Cores] Double the ray-triangle intersection rate of the previous generation to create photoreal, physically accurate scenes and immersive 3D designs with RTX Mega Geometry, which enables up to 100X more ray-traced triangles.
- [PCIe Gen 5] Support for PCIe Gen 5 provides double the bandwidth of PCIe Gen 4, improving data-transfer speeds from CPU memory and unlocking faster performance for data-intensive tasks like AI, data science, and 3D modeling. | [GDDR7 Memory] With 96 GB of GPU memory and 1.8 TB ps bandwidth, it can tackle massive 3D and AI projects, fine-tune AI models locally, explore large-scale VR environments, and drive larger multi-app workflows.
- [DisplayPort 2.1] Achieve unparalleled visual clarity and performance, driving high resolution displays at up to 8K at 240 Hz and 16K at 60 Hz. Increased bandwidth enables seamless multi-monitor setups while HDR and higher color depth support ensures superior color accuracy for precision work, such as video editing, 3D design, and live broadcasting.
- [NVIDIA Blackwell Streaming Multiprocessor] The new SM features increased processing throughput, and new neural shaders that integrate neural networks inside of programmable shaders | DLSS 4: Multi Frame Generation ensures ultra-smooth frame pacing for lifelike simulations. | [Universal MIG] Divide a single RTX PRO 6000 Blackwell into multiple isolated instances, each with dedicated resources, allowing for concurrent execution of multiple workloads, optimized GPU utilization, and secure isolation of different applications or users. [WARRANTY] 3 YR Manufacturer's Warranty. Bulk OEM Packaging. Retail Packaging is NOT included.
Microsoft Foundry documents evaluation across development and production, including pre-deployment datasets, sampled continuous monitoring, scheduled evaluation for drift, and red teaming. The specific evaluation design should reflect the application’s risks and success criteria; a single generic score cannot establish quality for every use case.
Should you use OpenTelemetry or a dedicated LLM observability platform?
OpenTelemetry (OTel) GenAI conventions are a reasonable shared-instrumentation starting point, particularly when AI spans need to connect with existing application traces. A dedicated cloud observability service may add dashboards, trace exploration, evaluation workflows, or integrations suited to a team’s existing environment. These choices are not mutually exclusive: instrumentation and conventions can help move telemetry, while a platform provides ways to inspect or evaluate it.
What’s actually slowing this PC down?
Pick the symptom - the matching free tool is one click away.
| Documented option | What its official documentation describes | Context to weigh |
|---|---|---|
| Microsoft Foundry with Azure Monitor Application Insights | Evaluation, monitoring, and OpenTelemetry-based tracing integrated with Application Insights; documented signals include quality and safety scores, token consumption, latency, errors, and agent/tool execution. | Relevant when the deployment already uses Microsoft’s cloud monitoring and Foundry workflows. Feature descriptions are from Microsoft documentation, not an independent comparison. |
| Amazon OpenSearch Service | Hierarchical AI-agent traces, GenAI semantic attributes, automatic capture for named frameworks and providers, and a trace exploration interface. | Relevant when OpenSearch Service and its documented instrumentation coverage fit the system. Verify framework and provider support for the actual deployment. |
| Google Cloud Application Monitoring | Agent dashboards and topology views, trace-derived metrics such as model-call counts and token use, and prompt/response inputs for quality analysis. Its documentation describes aggregation using application labels and events that follow OTel GenAI conventions. | Relevant when Google Cloud’s agent monitoring and telemetry model fit the team’s cloud environment and data controls. |
Choose by checking existing cloud and telemetry investments, framework and provider coverage, whether the full agent path is visible, available evaluation and safety workflows, access and retention controls, interoperability or export needs, and deployment-specific operational and usage costs. The cited documentation does not establish a universal best product or provide a like-for-like independent benchmark.
Independent reader supportYour contribution helps us test, update, and keep practical guides available for everyone.What is stable about OpenTelemetry GenAI conventions?
Current documentation from Microsoft, AWS, and Google Cloud uses or recommends OTel GenAI conventions for AI trace attributes and aggregation. This supports using OTel as a common starting point for representing AI execution in traces, especially alongside application telemetry.
Do not assume every proposed metric name, instrument type, or cost extension is settled. A May 2026 discussion in the OpenTelemetry specification repository records open questions about those areas and about separating spans, metrics, and sensitive events; a community discussion is not itself a ratified requirement. Check the live specification before treating a particular convention or extension as stable.
Rank #3
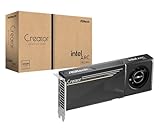
- System Compatibility Note: 2-slot card, 271x112x39mm, single 8-pin power, 200W TDP. Verify chassis clearance and PSU capacity before purchase.
- Dedicated Support: Please contact us directly through Amazon for any product questions or assistance you may require.
- 24GB GDDR6 on 192-Bit Bus: Massive 24GB memory with 456 GB/s bandwidth – ideal for LLMs, AI inference, 3D rendering, and generative design.
- Intel Xe2-HPG Architecture: Built on Intel's next-gen architecture with 20 Xe cores and 160 XMX engines for AI acceleration (197 INT8 TOPS).
- PCIe 5.0 Support: PCI Express 5.0 x16 interface for maximum bandwidth with the latest workstation platforms.
The same discussion recommends keeping high-cardinality or sensitive payloads—such as prompt text, completions, retrieved chunks, and user identifiers—out of metric labels, and separating spans, low-cardinality metrics, and events or logs. Treat that as guidance under discussion, not a finalized mandate.
How should you protect observability data?
Prompts, responses, retrieved content, user context, and tool arguments or outputs can contain sensitive information. More detailed telemetry can help reconstruct incidents and detect misuse, but it also increases the amount of data exposed to dashboards, logging pipelines, and retention systems.
Microsoft recommends data contracts that balance forensic needs with privacy, data residency, minimization, retention obligations, access controls, and encryption. Before broad rollout, define who can access each telemetry class, what content is collected or redacted, where it may be stored, and how long it is retained. Collect only what is needed to answer the team’s operational and quality questions, and avoid exposing sensitive content or high-cardinality values in metric dimensions.
How do you keep LLM observability useful after launch?
Observability needs ongoing ownership. Keep prompt, model, retrieval, tool, and policy changes identifiable in telemetry; review operational and evaluation trends together; and investigate regressions against the trace for the affected request or run. Update baselines and evaluation datasets when task expectations or system behavior change, while preserving the privacy and retention rules established for the telemetry.
Quick Recap
Product prices and availability are accurate as of the date/time indicated and are subject to change. Any price and availability information displayed on Amazon at the time of purchase will apply.

