Wildlife tracking can show whether animals change routes, stopover locations, travel speed, or their use of areas near turbines. Those patterns are evidence of a behavioral response in the animals and setting studied. They do not, by themselves, prove that migration has been blocked or that a population is declining. To estimate population consequences, scientists combine movement records with collision-fatality estimates, abundance and demographic data, turbine locations, species traits, and population models.
That distinction matters because “disruption” can describe several different outcomes: an animal may avoid a turbine, spend less time at a stopover, or speed up near infrastructure without suffering a measurable survival or reproduction loss. Tracking answers the movement question first; additional monitoring is needed to connect movement to population health.
As an Amazon Associate I earn from qualifying purchases.
What tracking can—and cannot—tell you
GPS collars, radio telemetry, satellite tags, and related systems record an animal’s location repeatedly over time. A sequence of locations can be compared with turbine positions, construction dates, habitat maps, weather, and seasonal migration periods. Researchers then test whether animals behave differently when turbines are nearby or when a project changes from planned to under construction or operating.
Windows Errors? Fix Them Before They Spread
Repair common Windows errors and clear accumulated junk for a smoother, more stable PC - no reinstall needed.Free scan · no reinstallCrashes, No Sound, or Screen Glitches?
Random freezes, missing sound and display glitches usually trace back to one bad driver. Find and replace yours safely.Free scan · under a minuteMovement responses that tracking can measure
- Route displacement: whether a migration path shifts around turbines or a facility.
- Avoidance or attraction: whether animals use turbine-adjacent areas less or more often than comparable habitat.
- Stopover selection: whether animals choose different resting or feeding sites.
- Travel speed: whether movement accelerates or slows near infrastructure.
- Route fidelity: whether individuals return to the same corridor after construction or operation begins.
- Timing and duration: whether migration starts, pauses, or finishes at different times.
These measurements identify where and when a behavioral response occurs. They do not automatically show that the response is harmful. An animal could detour through equally productive habitat, for example, or it could lose access to a critical stopover. Distinguishing those outcomes requires habitat quality, survival, reproduction, and population information.
#1 Best Overall
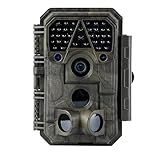
- Crystal-Clear 64MP Photos & 1296p HD Video – Stunning detail day or night, thanks to advanced image tech and a high-performance f/1.6 aperture lens.
- Lightning-Fast 0.1s Trigger Speed – Never miss a moment! Side sensors detect motion instantly, even for fast-moving wildlife, deer.
- Bright 100ft No-Glow Night Vision – Invisible 940nm LEDs and enhanced light capture deliver sharp nighttime footage without spooking animals.
- Smaller Files, Faster Playback – H.264 tech compresses videos (MP4/MOV) for quick downloads and seamless viewing on any device.
- 2.4" Color Display + User-Friendly Controls – Review footage on the spot with an intuitive menu and easy-access buttons.
Three different questions often confused
- Did behavior change? Tracking can address this directly when the sampling design is strong.
- Did animals die from collisions? Carcass searches and other fatality-monitoring methods estimate this separately from movement.
- Did the population decline? That requires demographic measurements and models that account for births, deaths, abundance, and cumulative pressures.
A study can provide convincing evidence for the first question without answering the second or third.
How researchers turn locations into evidence
Tagging and location schedules
Researchers fit selected animals with GPS collars or other transmitters and collect locations at scheduled intervals. GPS collars can provide fine-scale tracks for large mammals such as pronghorn. Radio and satellite telemetry can extend coverage where GPS is impractical or where animals range beyond cellular networks. Every approach samples particular animals, places, and periods; the tag schedule determines whether short detours or brief stopovers are visible.
Exposure and comparison
A useful analysis relates each location to turbine distance and to the animal’s migration stage. Scientists may compare movement before and after construction, animals exposed to a facility with animals in a similar control area, or paths with different levels of turbine exposure. Stronger designs account for season, weather, habitat, terrain, sex, age, project phase, and other factors that can influence movement independently of turbines.
The Tool Desk
Outbyte PC Repair FREERepair Windows errors before they cause bigger problemsFix Now →Outbyte Driver Updater FREEFix the driver behind crashes, sound loss and screen glitchesFind Drivers →Scale determines the inference
A track near one turbine is evidence at an individual or site scale. A facility-wide study can describe corridor use around that project. A regional or national assessment asks a different question: how many animals or species might be affected across many facilities? Results should never be generalized beyond the species, landscape, years, and turbine arrangement actually sampled.
Rank #2

- Easy WiFi Access: The GardePro E6 features ultra-low-power WiFi + Bluetooth technology and works exclusively with the GardePro Mobile App—no monthly fee required. Note: The E6 does not connect to home WiFi routers or cellular networks. This camera supports direct connection to a smartphone only, using Bluetooth and the camera’s built-in WiFi (range up to 45 ft). PCs, laptops, and web browsers are not supported for WiFi connection.
- 64MP Photos & 1296P HD Video: Equipped with a premium optical lens (110° wide view) and an advanced image sensor, the E6 captures exceptionally crisp 64MP photos and clear 1296P HD videos. With H.264 video encoding, you can preview photos and videos quickly without needing to download them first—saving time and storage.
- Live View for Real-Time Wildlife Observation: Use Live View to see exactly what’s in front of your camera in real time, without disturbing wildlife (connect up to 45 ft away in open areas). Ideal for observing birds, deer, foxes, or cave-dwelling animals. During installation, you can check the view to ensure there are no obstructions and the camera is properly positioned.
- No-Glow 940nm Infrared for Stealth Night Vision: Enhanced 940nm no-glow IR LEDs make the camera completely invisible at night. The adaptive illumination system prevents overexposure and ensures balanced brightness, delivering clear nighttime images up to 75 ft without disturbing wildlife.
- Long-Lasting Power Options: Powered by 8×AA 1.5V batteries (not included). For extended outdoor use, the E6 also supports the GardePro SP350 Solar Panel (sold separately), providing continuous, maintenance-free power even in remote locations.
What the Wyoming pronghorn study found
A USGS study of female pronghorn in south-central Wyoming provides a concrete example of GPS tracking applied to migration. Researchers monitored animals during 2010–2012 and 2018–2020 and analyzed 286 migration sequences from 117 individuals.
| Migration sequence | Number analyzed |
|---|---|
| Spring | 121 |
| Fall | 123 |
| Facultative winter | 42 |
| Total | 286 |
The pronghorn continued migrating through areas containing wind-energy facilities. At the same time, the models detected changes in stopover selection, distance from turbines, movement speed near turbines, and fidelity to routes near turbines that were under construction. “Continued migrating” therefore did not mean “no response”; the animals moved through the region while altering some aspects of how they used it.
Study-specific stopover results
In the study’s models, increasing distance from a turbine from 0 to 1 kilometre corresponded to a 33% increase in the relative probability of selecting a spring stopover and a 300% increase in the relative probability of selecting a winter stopover. These are relative probabilities from this pronghorn population, landscape, period, and model. They are not a general effect size for all wildlife or every wind facility, and they do not by themselves quantify survival or reproductive effects.
The findings illustrate why a track should be read as more than a line on a map. A migration corridor can remain passable while animals alter where they rest, how quickly they travel, or how closely they approach infrastructure. Whether those changes carry a cost depends on what habitat is available along the altered route and how the change affects energy, survival, and reproduction.
Rank #3
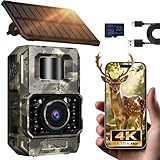
- Ultra-Low Power WiFi and Bluetooth Connected Tech: This trail camera, featured WiFi and Bluetooth use ultra-low power design and quick & easy TrailCam GO App free control, ensures longer battery life and convenient to preview, download, and send pictures/videos to cellphone without removing the SD card of trail cam. All data process locally via WiFi6 without cloud dependency to protect your privacy. (connection range up to 55 ft, open area required).𝐈𝐌𝐏𝐎𝐑𝐓𝐀𝐍𝐓 𝐍𝐎𝐓𝐄: 𝐎𝐮𝐫 𝐭𝐫𝐚𝐢𝐥 𝐜𝐚𝐦𝐞𝐫𝐚 𝐜𝐚𝐧 𝐜𝐫𝐞𝐚𝐭𝐞 𝐢𝐭𝐬 𝐨𝐰𝐧 𝐖𝐢𝐅𝐢 𝐭𝐨 𝐜𝐨𝐧𝐧𝐞𝐜𝐭 𝐚𝐧𝐝 𝐧𝐨𝐭 𝐬𝐮𝐩𝐩𝐨𝐫𝐭 𝐲𝐨𝐮𝐫 𝐡𝐨𝐦𝐞 𝐖𝐢𝐅𝐢.
- Rechargeable & Solar-Powered: This Trail camera features a built-in rechargeable battery that saves you money, reduces waste, and keeps the camera running longer. The new detachable, adjustable solar panel provides even more convenient, eco-friendly power in the field. And to support longer hunting trips, the hunting camera can easily connect to a power bank for reliable, continuous performance.Please note: This product was updated to the solar-powered version on December 25, 2025. Orders placed before that date are for the non-solar version.
- Low-Glow Night Vision up to 65 ft: The trail cameras with night vision motion activated waterproof are enhanced 850nm infrared LEDs to keep the trail cams discreet while capturing wildlife activity. Adaptive lighting automatically balances brightness, preventing overexposure or dark spots for clear, detailed images - even in total darkness.
- 64MP Photos + 4K Videos with Wide View: The WiFi trail camera can capture crisp 64MP images and ultra-clear 4K videos with a 100° wide-angle lens, ensuring no movement goes unnoticed. Advanced H.264 compression on our game cameras helps save storage space, speeds up file transfers, and makes sharing instant — no extra conversions needed.
- Full Kit + Smart Functions: This trail camera comes with all essentials for easy setup: mounting straps, bracket, 𝐩𝐫𝐞-𝐢𝐧𝐜𝐥𝐮𝐝𝐞𝐝 𝐒𝐃 𝐜𝐚𝐫𝐝 𝐚𝐭 𝐧𝐨 𝐞𝐱𝐭𝐫𝐚 𝐜𝐨𝐬𝐭, and user manual. The game camera also supports time stamp, scheduled shooting, and time-lapse mode—perfect for tracking wildlife activity, research, or outdoor projects. Backed by a 2-year support and dedicated one-on-one service for peace of mind.
What bat observations add—and why they are different
A separate USGS-summarized study used video to observe bat activity at one turbine in Colorado for a year. It detected bats on 177 of 306 nights, recorded approximately 3,800 hours of video, and documented more than 2,000 discrete bat events.
Activity showed seasonal peaks in July and September. Bats repeatedly approached the turbine, a pattern the authors said was consistent with possible investigative behavior. The study also said that the drivers of seasonal activity and movement required further study. This was turbine-adjacent behavioral observation, not a GPS analysis of migration routes, so it cannot establish that bats displaced a migration corridor or that the observed approaches caused population harm.
The study’s uncertainty is important. As the official summary puts it: “In northern temperate zones, fatalities occur mostly from July through October, but whether this reflects seasonally variable behaviors, passage of migrants, or some combination of factors remains unknown.” Seasonal activity, migration passage, and collision risk can overlap without being identical processes.
Why collision monitoring must be analyzed separately
Tracking reveals movement; it does not count every collision. Post-construction monitoring commonly uses carcass searches, searcher-efficiency trials, and adjustments for scavenger removal and missed carcasses to estimate fatalities. Those estimates answer a mortality question and can reveal seasonal patterns, but they are not direct measurements of route displacement.
Rank #4

- [Quick & Easy Setup, Simplified Monitoring] Forget about complicated installations! Our cellular trail camera is designed for effortless use, serving as a trustworthy cellular game camera with no WiFi required that works virtually anywhere. Through the app, you can connect it to your phone in just a couple of straightforward steps. Clear prompts and an intuitive interface get you operational in minutes, delivering a seamless smart monitoring experience straight from the box
- [Clear Data Plans, Start with Complimentary Data] This 4G trail camera comes with a pre-inserted SIM card and includes 100MB of FREE data so you can try it out immediately (A memory card is not included and must be purchased separately.)—ideal for those exploring game cameras free plan choices. All cellular trail camera 4G plan purchases are handled securely through app. (Note: Each camera needs a separate top-up; data cannot be shared between cameras.)
- [Solar-Powered Game Camera with Dual Night Vision] Engineered for non-stop monitoring, this solar powered trail camera features a high-efficiency game camera solar panel that greatly reduces worries about battery life. Equipped with six powerful IR LEDs, it offers both full-color and infrared night vision, meeting the expectations of waterproof, motion-activated game cameras with night vision. As a reliable deer camera solar powered unit, it captures crisp, clear footage day and night, rain or shine, making it a flexible game camera solar solution for any outdoor environment.
- [Smart Motion Alerts & Surveillance] Armed with advanced PIR smart sensors, this cellular solar powered trail camera pushes instant motion notifications right to your phone, functioning just like game cameras that send pictures to cell phone. It's perfect for cellular security cameras for wildlife monitoring and property protection. As an game camera, it delivers solid performance and ultimate peace of mind, whether you employ it as a deer camera or a general cellular security camera.
- [Crisp HD/SD Recording & Full Control, Check Footage Anytime, Anywhere] Customize your recordings by toggling between HD and SD modes on this live-feed capable cellular security camera. Access and manage your clips effortlessly through the intuitive phone app, enjoying the ease of a modern cellular security camera. Whether you're tracking with a trail camera two-pack cellular setup or observing backyard, you'll never miss a vital moment.
Evidence from pooled monitoring studies
A 2023 synthesis pooled 114 post-construction monitoring studies and found seasonal patterns in bird and bat collision fatalities that differed among species and bird guilds. The authors emphasized pooling data and expanding standardized monitoring because individual facilities and species can produce very different patterns.
Another synthesis reviewed 218 North American studies representing 100 wind-energy facilities. In the data analyzed, fatalities were concentrated among migratory tree-roosting bat species and occurred mostly from July through October. The authors called for more representative facility sampling to validate that pattern. The result is a useful regional signal, not a universal fatality rate or proof that every facility has the same seasonal risk.
Independent reader supportYour contribution helps us test, update, and keep practical guides available for everyone.How movement evidence becomes a population assessment
USGS’s 2019 methodology for assessing national and regional effects combines several data types rather than relying on tracks alone. The framework can incorporate fatality information, population estimates, species ranges, turbine locations, biological traits, and population models. Movement data help define where animals encounter facilities and how they respond, while demographic information determines whether that exposure could alter population trajectories.
Recommended Free Tools
The chain of inference
- Document exposure: map turbines against migration corridors, ranges, and tracked locations.
- Estimate behavioral response: quantify avoidance, detours, altered stopovers, speed changes, or route-fidelity changes.
- Estimate mortality: use standardized post-construction monitoring to calculate collision fatalities and seasonal risk.
- Link behavior to vital rates: test whether changed access or added travel affects survival, reproduction, body condition, or recruitment.
- Model cumulative effects: combine facility exposure with other projects, habitat change, climate, and species-specific population dynamics.
Each step introduces assumptions. USGS warns that estimates can be limited by sparse or unreliable inputs and by simplifying assumptions in the models. A precise-looking output is not automatically a precise measurement of population change.
Best Value

- 30MP Photos & 1080P HD Videos for Clear Wildlife Monitoring:Capture detailed outdoor moments with 30MP high-resolution photos and Full HD 1080P videos. The advanced image sensor delivers clear and vivid images during daytime and reliable performance in low-light environments. This mini trail camera helps capture wildlife activity, deer movement, and outdoor scenes with improved details, making it ideal for deer scouting,wildlife observation,and property monitoring.
- Fast Trigger & 850NM Infrared Night Vision:Equipped with a sensitive PIR motion sensor and fast trigger response, this game camera quickly detects movement and captures passing animals with minimal delay. The 850nm infrared LEDs provide clear black-and-white night vision images while reducing disturbance to wildlife, allowing continuous monitoring during both day and night.
- Mini Camouflage Design & Low Power Consumption:Designed with a compact and lightweight body,4.25 × 4.21 × 3.43 inches and weighing only 0.73lb (332g), this mini deer camera is easy to carry, install, and conceal outdoors. The camouflage appearance helps it blend into natural surroundings, making it less noticeable during wildlife observation. Powered by 4 AA batteries(Not include), the low-power design supports longer standby time for extended outdoor use.
- Easy Installation & Multiple Outdoor Applications:This wildlife camera comes with an adjustable mounting strap for quick installation on trees, posts, fences, and other outdoor locations. The simple setup allows users to start monitoring quickly after inserting an SD card (Max 32GB not included). Suitable for deer scouting, Backyard Observation, bird watching, garden monitoring, farm observation, and outdoor surveillance.
- User-Friendly Operation & Product Guidance:This wildlife camera features a user-friendly design for quick setup and effortless operation.Simply mount the camera using the included mounting strap and place it 3–4 feet away from the target area. The trail camera height can be adjusted according to the size and activity patterns of the animals you want to capture.
How to judge whether a tracking study is persuasive
When comparing studies, ask the following questions before treating a result as evidence of disruption.
- What outcome was measured? Route change, avoidance, stopover use, speed, turbine proximity, collision mortality, or population trend are different endpoints.
- Which species and seasons were included? A pronghorn result cannot be transferred to bats, and a July–October bat pattern does not describe spring migration.
- How many animals and years were sampled? More individuals, repeated seasons, and multiple years generally reveal more variation than a short snapshot.
- How often were locations recorded? Infrequent fixes may miss short detours or stopovers.
- Was there a comparison? Before/after data or a comparable control area helps separate turbine effects from weather, habitat, or broader annual changes.
- What was the project stage? Construction, operation, and planned facilities can produce different responses.
- What is the geographic scale? One turbine, one facility, a corridor, and a regional population assessment support different conclusions.
- Which assumptions drive the result? Sparse data, uncertain detection, model structure, and extrapolation should be visible in the interpretation.
A practical workflow for interpreting a new tracking result
- Identify the animal and setting. Record species, sex or age class when available, region, turbine layout, and study years.
- Define the claimed disruption. Determine whether the paper reports avoidance, a detour, stopover loss, speed change, collision risk, or a demographic effect.
- Check the comparison. Look for pre-construction data, control animals, control habitat, or statistical adjustment for weather and habitat.
- Separate observation from explanation. A track showing repeated approaches demonstrates behavior; it does not prove why the animal approached.
- Look for consequences beyond location. Search for survival, reproduction, energetic cost, abundance, or population-trend measurements.
- Match the conclusion to the evidence scale. State a site-specific behavioral finding as site-specific, and reserve population claims for analyses that include demographic and cumulative-effect information.
What remains uncertain
No universal distance threshold identifies when a route change becomes population-level harm. The Wyoming stopover estimates are tied to one pronghorn study region and period. The Colorado bat observations come from one turbine. Fatality syntheses reveal broad seasonal and species patterns but also call for more representative and standardized facility sampling.
Tracking programs also cover selected animals rather than every individual in a population. Tagging can favor animals that are large enough to carry a device, survive capture, and remain within the monitoring footprint. Weather, habitat conditions, turbine curtailment, and other infrastructure may change during the study. These limitations do not make tracking useless; they define how far its conclusions can travel.
Free tools Windows power users keep installed
One-click scans. No signup required.
The bottom line for readers and project decisions
Wildlife tracking is one of the clearest ways to detect whether turbines coincide with altered migration behavior. It can show a detour, reduced use of a stopover, changed speed, or different turbine proximity while migration continues. To decide whether that response harms a population, combine the movement evidence with collision estimates, habitat and range data, survival and reproduction measurements, and population modeling. Treat species, season, landscape, project stage, sample size, and uncertainty as part of the result—not as footnotes.
Quick Recap
Product prices and availability are accurate as of the date/time indicated and are subject to change. Any price and availability information displayed on Amazon at the time of purchase will apply.

