Reduce latency in a physical AI system by treating the complete sensing-to-actuation path as a timed control loop, then removing the largest measured source of delay. Moving inference from a remote service to an on-device or nearby edge computer can eliminate a network round trip, but it will not fix camera buffering, memory copies, ROS 2 queue backlogs, scheduler jitter, slow planning, or actuator handling. Set an application deadline, instrument every pipeline boundary, identify the bottleneck and its tail behavior, apply one targeted change at a time, and re-test under the full workload.
Start with a deadline, not a hardware number
A physical AI system is suitable for real-time use when it meets the application’s timing deadline predictably. A low average latency is not enough: one long-tail delay can cause a missed control update, an unsafe stop, or a poor manipulation decision. Define the deadline and acceptable jitter for the actual task before selecting an accelerator or changing software.
| # | Preview | Product | Price | |
|---|---|---|---|---|
| 1 |
|
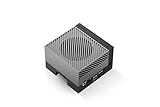
NVIDIA Jetson AGX Orin 64GB Developer Kit with Ethernet, USB, Display Port | $3,389.00 | Buy on Amazon |
As an Amazon Associate I earn from qualifying purchases.
Translate the task into timing requirements
Write the timing requirement in terms of the robot’s job. A high-level mapping or object-detection update may tolerate a much longer period than a balance controller or collision-avoidance loop. Specify:
Free tools Windows power users keep installed
One-click scans. No signup required.
- Update period: how often a new result is required.
- Deadline: the latest acceptable result time after the relevant sensor sample.
- Jitter limit: how much timing variation the controller can tolerate.
- Failure behavior: what the robot must do when a deadline is missed.
ROS 2’s real-time design guidance distinguishes deterministic timing from a favorable mean. Its tutorial uses an illustrative 1 kHz loop and evaluates maximum latency as a fraction of that period. The example is a measurement method, not a universal requirement for every robot.
#1 Best Overall
- The NVIDIA Jetson AGX Orin 64GB Developer Kit makes it easy to get started with Jetson Orin. Compact size, lots of connectors, and up to 275 TOPS of AI performance make this developer kit perfect for prototyping advanced AI-powered robots and other autonomous machines.
- The developer kit includes a Jetson AGX Orin 64GB module, and can emulate all the Jetson Orin modules. It supports multiple concurrent AI application pipelines with the NVIDIA Ampere GPU architecture, next-generation deep learning and vision accelerators, high-speed IO and fast memory bandwidth. Now you can develop solutions using your largest and most complex AI models to solve problems such as natural language understanding, 3D perception, and multi-sensor fusion.
- Jetson runs the NVIDIA AI software stack, and use-case specific application frameworks are available, including Isaac for robotics, DeepStream for vision AI, and Riva for conversational AI. You can save significant time with NVIDIA Omniverse Replicator for synthetic data generation (SDG), and by using NVIDIA TAO toolkit to fine-tune pretrained AI models from the NGC catalog.
- Jetson ecosystem partners offer additional AI and system software, developer tools, and custom software development. They can also help with cameras and other sensors, as well as carrier boards and design services for your product.
- With the computing capability of more than 8 Jetson AGX Xavier systems in a developer kit that integrates the latest NVIDIA GPU technology with the world’s most advanced deep learning software stack, you’ll have the flexibility to create tomorrow’s AI solution as well as today’s.
Separate control loops by urgency
Keep safety-critical and low-level control paths explicit and bounded. A cloud service may be appropriate for training, fleet analytics, map generation, or non-urgent optimization, while a collision reaction or torque command must continue when connectivity is intermittent. Document which functions are allowed to block on a network and which must run locally.
Model the complete latency path
End-to-end response time is the sum of delays and waits across the pipeline, not the neural-network execution time alone. A useful decomposition is:
- Sensor exposure, driver delivery, and timestamping.
- Camera or lidar buffering and synchronization.
- Preprocessing, decoding, resizing, normalization, and feature construction.
- Host-to-device transfers and other memory copies.
- Model inference and post-processing.
- Serialization, middleware transport, and callback scheduling.
- Planning or policy selection.
- Command publication, controller handling, bus transfer, and actuator response.
For each stage, distinguish active compute from waiting. A GPU may finish inference quickly while a callback waits behind a queue, or a camera may add more delay through buffering than the model adds through arithmetic.
Do these 3 things before closing this tab:
1Scan for outdated or missing drivers - takes under a minute2Repair Windows errors before they cause bigger problems3Fix the driver behind crashes, sound loss and screen glitchesWhy edge computing can help
Running deadline-sensitive inference on the robot or a nearby edge computer removes the request, transmission, remote queue, response, and retransmission risks associated with a distant service. It can also preserve operation during loss of continuous connectivity. The resulting local path still has to contend with CPU and GPU contention, thermal throttling, memory movement, operating-system scheduling, and actuator timing.
Measure robot latency end to end
Instrument timestamps at meaningful boundaries and retain the measurements long enough to see tail events. A single inference benchmark does not establish response time for a robot.
Place timestamps where decisions are made
At minimum, record:
- Sensor acquisition or driver-delivery time.
- Preprocessing start and completion.
- Inference start and completion.
- Planner or policy start and output.
- Command publication.
- Controller receipt and actuator acknowledgement, when those signals are available.
Use a consistent clock domain or a documented clock-synchronization method. Preserve the sensor frame identifier so that a command can be matched to the sample that caused it. If hardware timestamps and host timestamps differ, measure and report that offset rather than silently mixing them.
Report distributions, not one number
For every stage and for the complete sensor-to-command path, report median, high percentiles, maximum observed latency, jitter, throughput, and missed deadlines. Record the test duration and the maximum value under the stated workload. Include sensor rates, image sizes, model version, ROS 2 configuration, logging level, power mode, cooling conditions, and whether other nodes were active.
Recommended Free Tools
Repeat the test with all intended sensor streams, visualization, recording, communications, safety checks, and background services enabled. A quiet benchmark can hide contention that appears in deployment.
Capture scheduling and memory faults
ROS 2’s real-time tutorial discusses recording latency and page-fault statistics and comparing maximum latency with the selected update period. Page faults, allocation, lock contention, and scheduler preemption can create rare but consequential stalls. Capture these events alongside application timestamps so that a long-tail spike has an explainable cause.
Find the actual bottleneck before optimizing
Build a stage-by-stage latency budget from the baseline. Mark each stage’s mean and tail contribution, then test whether removing or shortening that stage changes end-to-end behavior. Do not convert a model, buy an accelerator, or change a ROS 2 transport solely because its advertised compute figure is high.
Common bottleneck signatures
| Observed symptom | Likely cause | First check |
|---|---|---|
| Large delay before preprocessing starts | Sensor buffering, driver queues, synchronization, or transport wait | Timestamp exposure, driver delivery, queue depth, and frame age |
| Inference time is stable but end-to-end latency spikes | CPU contention, page faults, callback backlog, blocking I/O, or scheduler jitter | Thread scheduling, memory faults, executor queues, and system load during spikes |
| GPU utilization is low while latency is high | Host-to-device copies, serialization, synchronization, or waiting for input | Copy durations and synchronization points around inference |
| Latency grows over time | Unbounded queues, accumulating frames, memory pressure, or a slow consumer | Queue length, frame age, dropped-frame policy, and allocation behavior |
| Commands publish on time but motion starts late | Controller, fieldbus, actuator firmware, or safety interlock delay | Command-receipt and actuator-acknowledgement timestamps |
| Performance degrades after sustained operation | Thermal throttling or power-limit changes | Clocks, temperatures, power mode, and sustained-load logs |
Use controlled experiments
Disable one stage at a time in a safe test environment, replace a model with a deterministic stub, or feed recorded sensor data at the intended rate. If end-to-end latency barely changes when inference is made faster, inference was not the limiting stage. Restore the original configuration after each experiment and keep the same measurement points.
The Tool Desk
Outbyte Driver Updater FREEScan for outdated or missing drivers - takes under a minuteDriver Scan →Outbyte PC Repair FREEClear out junk files and repair common Windows errorsFree Scan →Move the right work to the edge
Place perception or policy inference on-device or on a nearby edge computer when the measured network round trip is a significant part of the deadline and the local platform can sustain the workload. Keep non-urgent work remote when that simplifies operations without entering the control path.
Choose an edge placement
- On-robot computer: minimizes network transport and can continue during disconnection, but shares power, cooling, and resources with sensors and control.
- Nearby edge computer: can provide more compute while keeping a short, controlled link; account for link congestion and failure behavior.
- Remote service: useful for offline analytics and training, but its variable network and service queues are unsuitable for a deadline-sensitive loop unless a local fallback exists.
Define the handoff explicitly. A local node should not silently wait for a remote result when the deadline expires; it should use a bounded fallback, hold a safe command, or invoke the robot’s safety behavior.
Optimize the data path before chasing faster inference
Reduce buffering and stale frames
Use queue depths that match the control policy, timestamp frames at acquisition, and decide whether to drop old frames or process every frame. For a reactive controller, processing a fresh frame is often preferable to draining a backlog. Synchronization windows should be no wider than the sensor-fusion accuracy requires.
Minimize copies and serialization
Trace every transition between driver, middleware, CPU memory, accelerator memory, and planner. Remove avoidable format conversions and copies, and keep compatible components in a shared memory or zero-copy path where the deployed middleware supports it. Verify correctness: a zero-copy path that forces hidden synchronization can be slower than an explicit, well-timed transfer.
Use an inference runtime suited to the target
Model conversion, reduced precision, kernel selection, and runtime acceleration can lower compute time, but only if the resulting model is accurate enough and the rest of the pipeline can feed it. NVIDIA describes TensorRT-based policy deployment for Jetson robotics and presents Isaac ROS and NITROS as accelerated ROS 2 pipeline options. Treat these as implementation choices, then benchmark the complete configuration on the target sensor workload.
Measure preprocessing and post-processing separately. A smaller model can lose its advantage if image decoding, resizing, or result conversion remains on a contended CPU thread.
Make ROS 2 execution more predictable
Design deadline-sensitive callbacks for bounded work
- Preallocate messages and buffers where practical; initialize models, memory pools, and communication resources before entering the constrained loop.
- Avoid unbounded loops, dynamic allocation, blocking file or network operations, and waiting for services inside deadline-sensitive callbacks.
- Keep callbacks short and separate high-cost work from control publication.
- Choose queue depths and executor behavior deliberately so that backlog cannot grow without limit.
- Measure intra-process and inter-process communication in the exact release and hardware configuration you deploy.
Historical ROS 2 intra-process measurements show that communication strategy can materially affect a particular pipeline, but those results came from an older laptop and software setup. They should not be reused as current Jetson or robot performance numbers.
Control thread priorities and scheduling
Scheduler configuration affects observed timing. Give the most time-sensitive loop an appropriate scheduling policy and CPU affinity only after measuring the effect and confirming that other safety functions remain serviceable. A real-time kernel can reduce preemption latency, but it does not make an unbounded callback deterministic.
Windows Errors? Fix Them Before They Spread
Repair common Windows errors and clear accumulated junk for a smoother, more stable PC - no reinstall needed.Free scan · no reinstallOutdated Drivers Are Slowing You Down
One free scan finds every outdated or missing driver and matches the right update for your exact hardware.Free scan · exact hardware matchNVIDIA documents a PREEMPT_RT kernel in its JetPack software guide. Confirm the exact JetPack release, kernel support, driver compatibility, and deployment procedure for the board you use. Validate maximum latency after every kernel, driver, or executor change.
Independent reader supportYour contribution helps us test, update, and keep practical guides available for everyone.Balance compute, power and thermals
Physical AI workloads are sustained workloads. Compare systems on the latency distribution they maintain after minutes or hours, not only on a short peak test. Evaluate:
- Sustained inference and end-to-end tail latency for the actual model and sensor rates.
- Memory capacity and bandwidth for concurrent models, camera buffers, and middleware.
- Sensor interfaces, I/O throughput, and the physical data-movement path.
- Power envelope, cooling, enclosure, and battery constraints.
- Operating-system, driver, ROS 2, and runtime compatibility.
- Industrial support, safety architecture, and lifecycle requirements.
- Total integration effort and current system cost.
Jetson and IGX are different deployment contexts
NVIDIA positions Jetson as a compact edge family for robotics and IGX for industrial, medical, and safety-oriented edge use. Neither positioning establishes a universal latency winner. Select between them according to enclosure, power, support, safety, and measured workload requirements.
Interpret vendor figures carefully
NVIDIA’s January 5, 2026 Jetson T4000 technical blog lists up to 1,200 FP4 sparse TFLOPs and 64 GB of LPDDR5x in a 40 W to 70 W envelope. The same post reports up to 2× performance gains over Jetson AGX Orin on selected large-language-model, text-to-speech, and vision-language-action workloads. These are NVIDIA-published specifications and workload-specific comparisons; they do not predict a particular robot’s end-to-end response time.
What’s actually slowing this PC down?
Pick the symptom - the matching free tool is one click away.
NVIDIA’s Jetson Thor page lists a developer-kit starting price of $3,499 and T5000 modules starting at $2,999 for orders of 1,000 units. These are vendor-listed price points, not an independent street-price survey; verify current regional availability, configuration, and terms before budgeting.
An undated NVIDIA Jetson robotics guide says TensorRT optimization can allow heavy transformer policies to run in under 30 ms for real-time control loops. Treat that as vendor guidance, not a guarantee. In a separate NVIDIA description of its SONIC project, the kinematic planner is reported at around 12 ms per pass on Jetson Orin and the policy loop at 50 Hz. Those figures belong to that project’s implementation and workload.
Validate with simulation, hardware in the loop and the real robot
Simulation and hardware-in-the-loop testing can expose integration errors before a physical deployment. NVIDIA describes workflows for testing a policy in simulation and then on hardware. Use recorded or generated sensor streams, the production model, the intended ROS 2 graph, and realistic command timing.
- Run the complete graph against deterministic simulated sensors and verify timestamp propagation.
- Connect the production computer and interfaces in hardware-in-the-loop mode; measure transfers, scheduling, and controller behavior.
- Repeat with all logging, communications, safety functions, and sensor streams enabled.
- Perform controlled physical tests with conservative speed and safe fallback behavior.
- Compare median, tail, maximum latency, jitter, and missed deadlines with the baseline after each material change.
- Stress sustained operation until temperatures and clocks reach their normal steady state.
Simulation cannot prove actuator timing, thermal behavior, connector faults, or fieldbus contention. Final acceptance measurements must come from the physical system under its operating conditions.
Quick wins for a faster PC:
Clear out junk files and repair common Windows errorsFree Scan →Scan for outdated or missing drivers - takes under a minuteDriver Scan →A repeatable latency-reduction procedure
- Write the deadline. State the update period, maximum allowed response time, jitter tolerance, and safe action after a miss.
- Instrument the path. Timestamp sensor arrival, preprocessing, inference, planning, command publication, controller receipt, and actuation acknowledgement where available.
- Run a representative baseline. Include every sensor, model, node, logger, communication link, and safety function used in operation.
- Build a budget. Separate compute, queueing, copies, serialization, scheduler delay, and actuator handling; record tails and maximums.
- Test the largest contributor. Use a controlled experiment to confirm that changing it affects end-to-end latency.
- Apply one bounded change. Examples include moving inference local, reducing buffering, removing a copy, changing executor configuration, converting the model, or improving cooling.
- Re-measure under load. Keep the same workload and metrics so the before-and-after comparison is valid.
- Document the operating envelope. Record software versions, power mode, temperatures, sensor rates, model build, and failure behavior.
Troubleshoot missed deadlines
If the average is good but the maximum is not
Investigate scheduler preemption, page faults, dynamic allocation, lock contention, callback backlog, logging bursts, and thermal events. The remedy is usually bounded execution and resource isolation rather than a faster average inference kernel.
If moving inference local did not improve response
Check whether sensor buffering, preprocessing, copies, middleware, planning, or actuator handling dominates the budget. Confirm that the local node is not waiting on a remote service, a synchronized sensor, or a saturated device queue.
If latency worsens after adding a second sensor or model
Measure memory bandwidth, shared CPU and GPU utilization, queue age, and transfer overlap. A platform can have adequate peak compute but insufficient bandwidth or thermal headroom for concurrent streams.
If performance degrades only after warm-up
Compare clocks, temperatures, fan or enclosure conditions, and power limits between the first minute and steady state. Retest with the intended cooling solution and sustained workload; do not accept a short burst benchmark as the deployment result.
What a defensible performance claim looks like
State the complete test context: hardware and software versions, model and precision, sensor rates and resolutions, concurrent nodes, power and cooling, clock policy, test duration, and whether the number is median, percentile, or maximum. Say who produced the figure. Vendor claims such as NVIDIA’s T4000 specifications, Thor pricing, and SONIC timings are useful for planning, but they are not independent cross-vendor benchmarks.
A credible claim therefore reads like: “Under this sensor mix, model, ROS 2 graph, power mode, and sustained thermal condition, the measured sensor-to-command latency was X at the median, Y at the chosen tail percentile, and Z maximum, with N missed deadlines.” Without those conditions, a single millisecond or TOPS figure cannot answer whether a physical AI system will respond on time.
Bottom line
Edge computing reduces physical-AI latency when it removes a measured network or service delay and the local system is engineered as a deterministic pipeline. The winning sequence is deadline definition, end-to-end instrumentation, bottleneck isolation, targeted optimization, and validation under realistic sustained load. Choose hardware by tail latency, memory and I/O behavior, power and thermal stability, software support, and safety needs—not by a peak accelerator figure alone.
Quick Recap
Product prices and availability are accurate as of the date/time indicated and are subject to change. Any price and availability information displayed on Amazon at the time of purchase will apply.

