What’s actually slowing this PC down?
Pick the symptom - the matching free tool is one click away.
The cheapest production inference is useful work completed within its service-level objectives (SLOs), not the lowest advertised GPU hourly rate. Start by measuring cost per successful input and output token, queue time, time to first token (TTFT), end-to-end latency percentiles, quality, and accelerator utilization. Then improve utilization with continuous batching, remove repeated work with caching, reduce memory and compute with validated quantization, route simple requests to smaller models, use speculative decoding where it fits, and autoscale from queueing and latency signals rather than GPU utilization alone.
Re-benchmark after every change. Throughput, answer quality, memory headroom, and tail latency trade off differently for interactive chat, streaming APIs, and offline jobs, so an optimization that saves money in one workload can violate the SLO of another.

As an Amazon Associate I earn from qualifying purchases.
Define the cost you are actually trying to reduce
A GPU-hour is only an input to your economics. The decision metric should connect infrastructure spend to successful work delivered to users. A useful primary measure is total serving cost ÷ successful useful output tokens; for applications where input processing dominates, also report input-token cost. Include retries and failed requests in the numerator, and exclude abandoned work only when your accounting policy is explicit and consistent.
Build a baseline before changing the stack
Capture at least one representative period for each traffic class. Record:
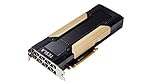
#1 Best Overall

- Product Number: AI-H100
- Product Condition: New and Original.
- The product is well packed in sealed box.
- Customer Service: JY-PLC provides 24-hour online customer service in 7 days. You are most welcome to contact us for any product or technical support issue.
- About US: JY-PLC is founded in 2015 with the business scope covering industrial automation, system integration, ecommerce trading, etc. JY-PLC is aimed at providing the best product and service for customers with high efficiency and standard.
- Input tokens, output tokens, requests, concurrency, and request rate.
- Queue time, TTFT, end-to-end latency, and p50, p95, and p99 values.
- Error, timeout, cancellation, and retry rates.
- GPU memory consumption, utilization, power where available, and the number of replicas.
- Application quality measures such as exact-match accuracy, extraction F1, groundedness, refusal correctness, or human preference.
- Cost per request, cost per successful request, and cost per useful input and output token.
Separate interactive, streaming, and offline workloads. An interactive user may need a bounded TTFT and tight tail latency, while an overnight summarization job can trade waiting time for large asynchronous batches. Combining them into one average hides the queueing and capacity that each service needs.
Make the baseline reproducible
Keep a fixed evaluation set that reflects production prompt lengths, languages, tool calls, safety cases, and long-context requests. Record model version, runtime, precision, maximum context, batch limits, hardware, and traffic mix with every benchmark. Change one major variable at a time, then compare quality and latency at the same load rather than comparing an idle test with a saturated one.
Raise accelerator utilization without breaking latency SLOs
Utilization is a first-order cost lever. NVIDIA’s serving guidance describes optimizing the full inference stack as the fastest way to lower the energy cost of production serving and specifically calls out token measurement, batching, precision, model size, serving software, accelerator utilization, and facility efficiency.
Recommended Free Tools
Use continuous or in-flight batching for variable arrivals
Static batching waits for a fixed group of requests, which is inefficient when requests arrive at different times or generate different numbers of tokens. Continuous (also called in-flight) batching admits new sequences as others finish, keeping the accelerator busy while reducing the idle gaps caused by uneven sequence lengths.
Tune these controls together:
- Maximum batch size: raise it until throughput gains flatten or memory and latency limits are reached.
- Batch wait window: a short window can gather work; a long window improves batch fullness but delays the first token.
- Maximum sequence length: cap pathological contexts so one request cannot consume the entire batch’s memory.
- Admission control: reject, defer, or shed work before the queue grows beyond the SLO.
- Fairness: prevent a stream of long generations from starving short requests.
Measure TTFT and p95/p99 end-to-end latency while changing each setting. A higher average tokens-per-second figure is not an improvement if users experience an unacceptable tail.
Choose batching by workload
| Workload | Primary objective | Operational approach |
|---|---|---|
| Interactive request/response | Bounded TTFT and tail latency | Use continuous batching with a short, measured wait window, strict admission control, and separate limits for prompt and generation length. |
| Streaming generation | Fast first token and stable inter-token latency | Protect active streams from queue spikes; monitor TTFT and token gaps, not only completed-request throughput. |
| Offline or asynchronous jobs | Maximum throughput and low cost per token | Accumulate larger batches and schedule them when capacity is available; retries can be handled outside the user-facing latency budget. |
Google documents a Batch API for its Gemini service at 50% of standard cost. That is a product-specific price for that service, not a general discount that applies to every hosted model or provider.
Use memory-aware serving
Long contexts and concurrent generations consume key-value (KV) cache memory. Runtimes that manage KV blocks efficiently, including PagedAttention-capable implementations, can fit more active sequences without reserving one large contiguous region for each request. Test memory headroom under the longest realistic prompts, not only the median prompt.
Do these 3 things before closing this tab:
1Scan for outdated or missing drivers - takes under a minute2Clear out junk files and repair common Windows errors3Fix the driver behind crashes, sound loss and screen glitchesReduce computation and memory with precision changes
Post-training quantization is usually the fastest precision experiment because it compresses an already trained model without retraining. NVIDIA describes converting FP16, BF16, or FP8 weights and activations into formats such as FP8, NVFP4, INT8, or INT4 with a calibration dataset.
A safe quantization sequence
- Choose a representative calibration set. Include the prompt lengths, domains, languages, tool calls, safety prompts, and rare entities that matter in production.
- Quantize a copy of the production model. Keep the original precision artifact available for instant rollback.
- Run quality and safety gates. Check factuality, extraction accuracy, refusal behavior, tool-call validity, and long-context retrieval against the fixed evaluation set.
- Load-test at target concurrency. Compare memory use, throughput, TTFT, p95/p99 latency, and error rates; quantization can shift bottlenecks from compute to memory or communication.
- Canary the change. Route a small, observable fraction of traffic to the quantized version and define automatic rollback thresholds before increasing exposure.
NVIDIA reported a configuration-specific 43.5% reduction in Llama-3.1-8B weight memory from FP8 post-training quantization in 2026. The figure applies to that model and configuration; it is not a promise of the same reduction for another architecture, runtime, or workload.
When quantization is not enough
If the quality loss is outside your acceptance range, test quantization-aware training, distillation, pruning, or a smaller specialist model. These approaches require more engineering or training data than post-training quantization, so compare their total project cost with the recurring serving savings. A smaller model that handles only classification or extraction can be more economical than compressing a general model that is still oversized for the task.
Rank #3

- Graphics Card Interface: Pci E
Avoid paying for repeated work
Caching reduces both computation and accelerator occupancy, but only when correctness and isolation rules are explicit.
Free tools Windows power users keep installed
One-click scans. No signup required.
Cache the layers that are stable
- System prompts and shared prefixes: reuse the KV state for an unchanged prefix when the runtime supports prefix or prompt caching.
- Embeddings: cache vectors keyed by normalized document text, embedding-model version, and preprocessing version.
- Retrieval results: cache queries with a freshness policy; invalidate when documents, permissions, or ranking configuration change.
- Deterministic outputs: cache only when temperature, tools, user permissions, and relevant application state make a repeated answer safe.
- KV cache: retain active conversation state efficiently, with an eviction policy that protects high-value sessions.
Define tenant, user, and data-class boundaries before enabling a shared cache. A cache key must include every variable that can change the answer, including authorization scope, locale, model version, prompt template version, and retrieval index version. Set a maximum age and an invalidation path; stale or cross-tenant data can cost more than the GPU time you saved.
Serve easy requests with smaller models
Model routing lowers cost by matching model capability to task difficulty. Route classification, extraction, short answers, formatting, and low-risk requests to a smaller or distilled model. Reserve the largest model for complex reasoning, ambiguous instructions, difficult tool use, or cases where the smaller model fails a confidence check.
Design a router with a measurable fallback
- Label production requests by task, input length, required tools, risk level, and observed quality.
- Benchmark candidate models on the same prompts and report quality, cost per useful token, TTFT, and tail latency.
- Start with high-confidence routes, such as fixed schemas or short classification prompts.
- Send uncertain cases to the larger model using a confidence threshold, validator, or error detector.
- Track fallback rate and quality by route; a router that sends most traffic to the large model is adding complexity without saving much.
Routing adds its own latency and operational surface. Keep the decision model small, deterministic where possible, and versioned with the route policy. Re-evaluate routes when prompt templates, model versions, or traffic composition change.
Use speculative decoding selectively
Speculative decoding pairs a small draft model with a larger target model. The draft proposes tokens, and the target verifies them in larger parallel steps. It helps when the draft is fast and predicts tokens the target commonly accepts; it can add overhead when acceptance is low or requests are very short.
The Tool Desk
Outbyte Driver Updater FREEFix the driver behind crashes, sound loss and screen glitchesFind Drivers →Outbyte PC Repair FREERepair Windows errors before they cause bigger problemsFix Now →Rank #4

- Discrete graphics card memory 40 GB
- Memory bandwidth (max) 1555 GB/s
- Graphics processor family NVIDIA
- Graphics processor A100
NVIDIA reported a 3x Llama 3.3 70B inference-throughput improvement in a TensorRT-LLM speculative-decoding example measured on December 11, 2024, using FP8, batch size 1, and DGX H200 hardware. Treat that as a benchmark under stated conditions, then reproduce it with your prompts, context lengths, concurrency, and latency target before budgeting for the gain.
Autoscale from demand and SLO signals
GPU utilization alone is a weak capacity indicator. A device can report healthy utilization while requests queue, KV memory is exhausted, or TTFT violates the product SLO. AWS recommends combining application and accelerator telemetry and scaling around demand and SLOs rather than one utilization number.
Export the signals an autoscaler needs
- Queue depth and queue age.
- Request rate, active concurrency, and tokens waiting or being generated.
- TTFT and end-to-end p95/p99 latency.
- vLLM application metrics where that runtime is used.
- GPU utilization, memory used, memory fragmentation, power, and temperature from DCGM or equivalent telemetry.
- Error, timeout, cancellation, and retry rates.
Scale out when queue age or latency approaches its limit, with cooldowns long enough to avoid oscillation. Scale in only after sustained low demand and after draining active streams. Keep a warm minimum for interactive services if model load time would otherwise consume the latency budget.
Size replicas from concurrency and context
Choose GPU memory, tensor or pipeline parallelism, and replica count from measured concurrency, context length, output length, and throughput. A model that fits at idle may fail when several long prompts allocate KV cache simultaneously. Test the worst realistic combination and leave headroom for allocator fragmentation and rolling updates.
Compare deployment choices with a common scorecard
Cloud instances, owned servers, managed model APIs, and CPU or edge deployments have different fixed and variable costs. Compare them with the same traffic trace and quality gates.
Best Value
| Dimension | What to measure | Why it changes the decision |
|---|---|---|
| Unit economics | Cost per successful request and useful input/output token | Prevents a low hourly rate from hiding retries, idle capacity, or long prompts. |
| Performance | Throughput at target concurrency, TTFT, p95/p99 latency, and inter-token time | Shows whether the option meets interactive or batch SLOs. |
| Quality | Task-specific accuracy, safety, groundedness, and fallback rate | A cheaper model is not cheaper if it creates rework or escalations. |
| Memory and utilization | Peak KV memory, weight memory, fragmentation, and sustained utilization | Determines how many replicas are required and how much capacity is stranded. |
| Elasticity | Scale-out time, minimum capacity, and scale-in behavior | Matters when demand is spiky or seasonal. |
| Operations | On-call effort, upgrades, observability, data residency, and failure recovery | Captures costs that do not appear on an instance invoice. |
Cloud capacity often wins when demand is uncertain or highly variable because elasticity has value. Owned hardware can win at sustained high utilization when procurement, power, cooling, networking, and operations are already available. Recalculate when model versions, token mix, traffic shape, or provider prices change.
An AI Infrastructure Alliance report from 2024 found approximately 52% of respondents seeking cost-effective alternatives to GPUs for inference, compared with 27% for training. That is a market signal about pressure on inference economics, not a universal savings estimate for a particular application.
A practical rollout plan
Phase 1: establish guardrails
- Define SLOs for TTFT, end-to-end p95/p99 latency, availability, and quality.
- Instrument tokens, queueing, concurrency, memory, power where available, and cost per useful result.
- Freeze a representative evaluation set and a replayable traffic trace.
- Set rollback thresholds for quality, safety, errors, and latency.
Phase 2: improve utilization
- Enable continuous batching in a staging environment.
- Tune batch size, wait window, sequence limits, and admission control against the SLOs.
- Separate interactive and offline queues so batch jobs cannot consume interactive capacity.
- Measure cost per useful token at the same quality and load as the baseline.
Phase 3: reduce per-request work
- Apply post-training quantization and run the full quality, safety, and tail-latency evaluation.
- Enable prefix, embedding, retrieval, and deterministic-output caches with explicit invalidation and tenant isolation.
- Adopt KV-cache management and PagedAttention-capable serving where long context or concurrency limits capacity.
Phase 4: change model paths
- Benchmark smaller or distilled models on bounded tasks.
- Introduce routing with a measured fallback to the larger model.
- Test speculative decoding on the longest-running generation paths.
Phase 5: automate capacity
- Export vLLM and GPU telemetry to the monitoring system when applicable.
- Build autoscaling policies from queue age, request rate, concurrency, TTFT, end-to-end latency, and GPU memory signals.
- Load-test scale-out, scale-in, rolling updates, and node failure before production exposure.
Troubleshoot the most common cost failures
GPU utilization is high but throughput is poor
Check memory bandwidth, KV-cache pressure, context length, kernel compatibility, and synchronization overhead. High utilization can represent stalled or inefficient work. Compare tokens per second and cost per useful token, then test a different batch limit, precision, or runtime kernel.
Batching reduced cost but broke TTFT
Shorten the wait window, cap batch occupancy, reserve capacity for interactive traffic, and scale on queue age. Keep larger batches on an asynchronous queue instead of allowing them to delay user requests.
Quantization lowered quality
Identify which tasks and token positions regress. Try a higher precision format, mixed-precision layers, a better calibration set, quantization-aware training, or a smaller specialist model. Do not ship a global quality regression to obtain a memory saving.
The cache returns stale or unsafe answers
Audit the key for model, prompt, retrieval, locale, authorization, and tenant variables. Add versioned invalidation, maximum age, and a bypass for safety-sensitive or state-changing requests. Purge entries created under the faulty policy before re-enabling the cache.
Autoscaling reacts too late
Measure model load time and queue growth separately. Scale on leading indicators such as queue age, pending tokens, and active concurrency, maintain warm capacity for interactive traffic, and use a cooldown that matches startup and drain times.
Windows Errors? Fix Them Before They Spread
Repair common Windows errors and clear accumulated junk for a smoother, more stable PC - no reinstall needed.Free scan · no reinstallCrashes, No Sound, or Screen Glitches?
Random freezes, missing sound and display glitches usually trace back to one bad driver. Find and replace yours safely.Free scan · under a minuteQuick Recap
Decision rules for the next optimization
- If GPUs are idle between uneven arrivals, start with continuous batching and queue-aware admission control.
- If memory limits concurrency, test quantization, KV-cache management, context limits, and PagedAttention before buying more hardware.
- If repeated prompts, documents, or outputs dominate, implement correctly scoped caches before changing models.
- If most requests are simple, benchmark routing to a smaller model and measure fallback rate.
- If generation dominates latency on a large model, test speculative decoding under your own prompt distribution.
- If demand is spiky, value elasticity and queue-aware autoscaling rather than comparing only steady-state hourly prices.
- If every optimization changes quality or tail latency, keep the baseline and choose the option with the lowest cost per useful result, not the highest raw throughput.
Product prices and availability are accurate as of the date/time indicated and are subject to change. Any price and availability information displayed on Amazon at the time of purchase will apply.

