The Tool Desk
Outbyte Driver Updater FREEScan for outdated or missing drivers - takes under a minuteDriver Scan →Outbyte PC Repair FREERepair Windows errors before they cause bigger problemsFix Now →To read a LiDAR map of an archaeological site, first identify the underlying elevation data and rendering, then compare several terrain views, and finally test any apparent feature against historical, environmental and field evidence. A ridge, ditch, mound or straight line in a hillshade is evidence of surface form—not proof of human construction, age or purpose.
LiDAR is a record of topography captured during a particular survey period. It can expose subtle traces beneath woodland, but it can also hide buried remains, amplify processing artefacts and combine evidence from many periods into one modern-looking image.
As an Amazon Associate I earn from qualifying purchases.
What a LiDAR archaeological map actually shows
LiDAR (light detection and ranging) measures distances with laser pulses and records the returns as a three-dimensional point cloud. Returns may come from bare ground, vegetation, buildings, walls and other objects. A map labelled “LiDAR” is often not that raw point cloud; it is usually a terrain surface or an image rendered from one.
Crashes, No Sound, or Screen Glitches?
Random freezes, missing sound and display glitches usually trace back to one bad driver. Find and replace yours safely.Free scan · under a minuteWindows Errors? Fix Them Before They Spread
Repair common Windows errors and clear accumulated junk for a smoother, more stable PC - no reinstall needed.Free scan · no reinstallPoint cloud
A point cloud is a collection of individual XYZ measurements, often with attributes such as return number, intensity and classification. It preserves the observations most directly, but it is not automatically an easy-to-read archaeological map. You may need to filter points, classify them and generate a surface before low-relief features become apparent.
#1 Best Overall
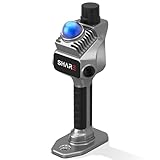
- 1cm High-Precision & 70m Long-Range Scanning: Engineered for demanding terrain and architectural surveying. Equipped with dual 1-inch large-area CMOS sensors delivering 16MP resolution per lens (2.4μm pixel size). It reliably captures spatial data from 0.1 to 40 meters (@ 10% reflectivity) and up to 70 meters (@ 80% reflectivity) for highly accurate 3D mapping.
- 360° LiDAR FOV & Distortion-Free Modeling: Rapidly scan large-area indoor and outdoor spaces in minutes with an expansive 360° × 59° field of view. The built-in mechanical shutter effectively eliminates motion distortion (rolling shutter effect), while dual 16MP ultra-wide cameras (32MP combined) ensure flawless close-range photogrammetry and precise object modeling.
- True-Color Point Cloud with Hardware Sync: Ideal for professional VFX, CGI, and digital twin workflows. Microsecond-level system-wide hardware synchronization ensures perfect alignment of real color and intensity. Combined with global shutter technology, it guarantees the seamless integration of rich color data into highly accurate point clouds.
- Open Algorithm & 3D Gaussian Splatting (3DGS): Designed for advanced, industry-specific pipelines. The system provides raw data accessibility to support custom SLAM algorithm integration, and optimized 3D Gaussian Splatting (3DGS) workflows using precise image pose metadata.
- Complete Software Ecosystem & Multi-Format Export: SHARE Capture and SHARE PointClouds Studio are included for SHARE3DCAM users at no additional software license cost. Preview point clouds in real time on mobile, then process, review, measure, and crop project data on desktop. Export point clouds in PLY, LAS, PCD, E57, and RCS formats, and export CAD floor plan and section drafts as DWG files for downstream CAD and BIM workflows.
Digital elevation model (DEM)
A DEM is an elevation surface arranged as regularly spaced grid cells. Each cell represents an interpolated or otherwise derived elevation value. Cell size, interpolation method and the source points affect how much detail survives in the final raster.
Bare-earth DEM or DTM
A bare-earth model attempts to retain ground elevations while excluding buildings, trees and other above-ground objects. It is usually the starting point for finding banks, ditches, hollow ways and earthworks beneath open or wooded terrain. “Bare earth” does not mean untouched reality: point classification and interpolation still determine which returns become ground and how gaps are filled.
Digital surface model (DSM)
A DSM represents the upper surface, including objects such as tree canopies and roofs. Use it when those objects are relevant, but do not expect a DSM to provide the same view of ground microrelief as a bare-earth model. Comparing both can help distinguish a genuine ground feature from a canopy or building effect.
Recommended Free Tools
Before interpreting a line or mound, record the layer name, acquisition date, horizontal resolution or cell size, vertical datum, point density where available, and classification and processing notes. Those details define what the image can and cannot support.
Learn the visual language of common terrain layers
Each rendering emphasizes a different property of the landscape. None is a universal archaeological decoder.
| Layer or rendering | What it expresses | Useful questions | Main caution |
|---|---|---|---|
| Single-direction hillshade | Simulated illumination makes slopes, ridges, hollows, banks and scarps appear through light and shadow. | Does a possible boundary or earthwork have coherent relief? | Contrast depends on the chosen light direction and altitude. A feature can disappear or look stronger when illumination changes. |
| Multidirectional hillshade | Combines illumination from several directions. | Does a suspected feature persist when one artificial “sun” is no longer dominant? | It reduces directional bias but remains a visualization of the elevation model, not a photograph. |
| Slope | Shows the maximum rate of elevation change around each cell. | Where are steep edges, scarps or cut banks, and where are flatter interiors? | A steep edge does not identify its cause; geology, erosion and construction can look alike. |
| Aspect | Shows the compass direction a slope faces. | How does a slope align with drainage, ridges or a valley? | Aspect is orientation information, not a feature label. |
| Contours | Lines connect points of equal elevation. | What is the relative height, shape and continuity of a mound, terrace or valley? | Contour interval and smoothing can simplify or exaggerate form. |
| Elevation-tinted hillshade | Combines shaded relief with colour-coded elevation. | Can you see both the shape and its relative position in the landscape? | Colour ramps can draw attention to boundaries that are not archaeological. |
USGS defines hillshade as a function that creates an illuminated representation of a surface using a hypothetical light source to enhance terrain visualization. Treat that definition literally: the “light” is calculated, not sunlight recorded at the site.
A step-by-step method for reading a LiDAR map
1. Establish the data source and processing
- Identify the product. Is it a point cloud, bare-earth DEM/DTM, DSM, intensity image or a derivative such as slope?
- Read the metadata. Note acquisition date, cell size, point density if supplied, vertical datum, coordinate system, classification rules and interpolation or filtering notes.
- Check the geographic extent. Coverage and resolution vary between surveys and locations. Do not assume that a detailed-looking image represents every part of the map at the same quality.
The acquisition date matters because a LiDAR surface is a snapshot. A later road, forestry operation, flood, building or restoration project may have changed the ground after the survey, while older traces may already have been removed.
Rank #2

- 4K Ultra Imaging
- Up to 100m Scan Range
- 2-Hour Swappable Battery
- 1.1kg Ultra-Light Design
- [Raven Handheld LiDAR Scanner] Designed as an easy-to-use LiDAR scanner for everyone, Raven packs a 50m scanning radius into a pocket-sized body, letting you map entire stadiums in under 5 minutes and capture everything from indoor spaces to larger outdoor environments in minutes.
2. Orient yourself in the natural terrain
Start with the broad landscape rather than the suspected “site.” Locate ridges, valleys, drainage lines, terraces, slopes and natural breaks. Use contours and elevation tint to understand relative height, then use slope and aspect to examine how surfaces connect.
Ask whether the pattern makes sense as geology, water movement or erosion before proposing a human explanation. A sinuous hollow that follows a fall line may be a gully; a level terrace beside a stream may be a natural bench. Archaeological interpretation becomes stronger when a candidate feature is unusual in its setting, not merely visible in isolation.
3. Compare illumination directions
Inspect a conventional hillshade and then change the simulated light direction or use a multidirectional hillshade. A linear bank visible only under one azimuth may be a lighting effect or a very directional slope. A feature that remains coherent across several directions and products deserves closer attention.
Do not “rotate the sun” until a desired answer appears. Save the settings you use and compare the same area systematically. Shadows can make a ditch look like a bank, reverse the apparent prominence of a slope, or hide a feature aligned with the illumination.
4. Compare terrain products, not just colour palettes
Switch between hillshade, slope, contours and elevation-tinted views at the same scale. A genuine break in slope may register in several products, while a colour transition or interpolation seam may appear in only one. Compare the bare-earth model with the DSM when canopy or structures could be involved.
Look for continuity: does a possible wall continue across a sensible distance, maintain a consistent width or height, and relate plausibly to entrances, roads, drainage or other terrain? Coherence is a reason to investigate, not confirmation.
5. Build competing explanations
Write down at least one archaeological and one non-archaeological explanation for every candidate. Consider:
Rank #3

- 【MicroROS Technology Application】Using MicroROS virtual machine as PC main control, through WiFi-UDP wireless communication, without carrying a bulky computer, the radar data can be wirelessly transmitted to the PC virtual machine. (VM software not support MAC). Support RaspberryPi 5,Jetson Nano,RDK X5 as the main control,which can replace VM and provide complete information.
- 【IMU positioning function and anti-shake reminder】With 6-axis IMU,it plays an important positioning function in map construction.At the same time, in order to prevent the lidar from tilting too much and causing distortion of map data,the research and development cleverly combined IMU to design an anti-shake reminder function.If PALMSLAM tilts in the map, there will be a buzzer alarm prompt (the alarm tilt angle is set after powering on).
- 【Perception enhancement is not limited to the plane】5 lidar versions are available for selection X3PRO/TMINI PLUS/C1/MS200/4ROS,providing precise positioning,scanning frequency, measurement radius data and multi-dimensional information, enhancing perception, not limited to the plane, making the operation more accurate and reliable.if used by beginners, it is recommended to order the Tmini-Plus version.
- 【Support IOS and Android APP】Run the ROS2 system on the PC virtual machine to realize mapping,and cleverly transfer the mapping data to the APP mobile phone through the APP,so that the Palmslam handheld can view the lidar mapping in real time and explore and scan the unscanned areas.
- 【Complete SDK tutorial and support ROS2】Provides compatible handheld mapping, five lidars support ROS2/ROS1, Linux and other document SDK development packages,support ROS and ROS2 operating systems, open Python source code,and provide relevant video tutorials to help customers develop and integrate smoothly across different operating systems and architectures.
- natural geology, glacial deposits, bedrock edges and sinkholes;
- erosion channels, landslides, flood deposits and animal paths;
- vegetation or canopy effects, misclassified returns and interpolation artefacts;
- recent forestry, agriculture, quarrying, roads, drains, utilities and landscaping;
- historical banks, ditches, foundations, walls, platforms, roads or extraction features.
Shape alone cannot establish a date, cultural affiliation or function. A rectangular depression might be a foundation, a modern pool, a tank or a deliberately levelled patch. The NOAA repository-hosted study on interpreting landscape palimpsests warns that derivative imagery can be difficult to interpret objectively without proper context.
6. Check independent records
Compare the candidate with historical maps, aerial photographs from multiple dates, archival documents, property and land-use histories, geological or soil information, and known sites in the area. A feature appearing on an old map as a road or field boundary has a different evidential status from an unexplained mark that appears only in one processed raster.
Use independent records to test both presence and absence. A missing feature on an old map does not prove it was not there—the map may be too small-scale, incomplete or made after the feature had vanished. Conversely, a line on a historical map may no longer survive on the ground.
7. Validate appropriately
When the interpretation remains important or uncertain, seek qualified archaeological or geomorphological advice and, where lawful and safe, field observation. Field checks can reveal whether a mapped bank is a real change in slope, a drainage cut, a stone wall, dense vegetation or a modern disturbance.
Do not enter restricted land, move stones, dig, collect artefacts or disturb a suspected site without permission and without checking applicable heritage law. A map-based candidate is a hypothesis for responsible investigation, not an invitation to excavate.
Do these 3 things before closing this tab:
1Repair Windows errors before they cause bigger problems2Scan for outdated or missing drivers - takes under a minute3Clear out junk files and repair common Windows errorsHow to tell a possible archaeological trace from a natural feature
No universal visual key reliably identifies every archaeological form. Instead, evaluate several properties together.
Geometry and regularity
Human construction can produce straight alignments, repeated angles, consistent widths or enclosed spaces. Those patterns become more persuasive when they persist across several renderings and fit the terrain. Regularity is not decisive: roads, drainage channels, forestry tracks and modern engineering also create geometric forms.
Rank #4

- 【MicroROS Technology Application】Using MicroROS virtual machine as PC main control, through WiFi-UDP wireless communication, without carrying a bulky computer, the radar data can be wirelessly transmitted to the PC virtual machine. (VM software not support MAC). Support RaspberryPi 5,Jetson Nano,RDK X5 as the main control,which can replace VM and provide complete information.
- 【IMU positioning function and anti-shake reminder】With 6-axis IMU,it plays an important positioning function in map construction.At the same time, in order to prevent the lidar from tilting too much and causing distortion of map data,the research and development cleverly combined IMU to design an anti-shake reminder function.If PALMSLAM tilts in the map, there will be a buzzer alarm prompt (the alarm tilt angle is set after powering on).
- 【Perception enhancement is not limited to the plane】5 lidar versions are available for selection X3PRO/TMINI PLUS/C1/MS200/4ROS,providing precise positioning,scanning frequency, measurement radius data and multi-dimensional information, enhancing perception, not limited to the plane, making the operation more accurate and reliable.if used by beginners, it is recommended to order the Tmini-Plus version.
- 【Support IOS and Android APP】Run the ROS2 system on the PC virtual machine to realize mapping,and cleverly transfer the mapping data to the APP mobile phone through the APP,so that the Palmslam handheld can view the lidar mapping in real time and explore and scan the unscanned areas.
- 【Complete SDK tutorial and support ROS2】Provides compatible handheld mapping, five lidars support ROS2/ROS1, Linux and other document SDK development packages,support ROS and ROS2 operating systems, open Python source code,and provide relevant video tutorials to help customers develop and integrate smoothly across different operating systems and architectures.
Relationship to terrain
Ask why a feature is where it is. A settlement platform may occupy a usable terrace; a road may follow a contour; a defensive bank may use a natural scarp. A proposed explanation that ignores slope, water and access is weaker than one that accounts for them.
Relief profile
Use contours and slope to distinguish a raised bank from a hollow ditch or a flat platform from a mound. A hillshade alone can invert your impression because illuminated and shaded sides alter apparent height. Cross-sections or elevation profiles, when available in the viewer, help test whether the relief is substantial, subtle or irregular.
Quick wins for a faster PC:
Clear out junk files and repair common Windows errorsFree Scan →Fix the driver behind crashes, sound loss and screen glitchesFind Drivers →Repair Windows errors before they cause bigger problemsFix Now →Pattern and association
One mound is ambiguous. A group of similarly oriented platforms, boundaries and access routes may form a landscape pattern. Association does not prove a single date or function; a present surface can preserve traces from different periods that overlap.
Persistence across data
Features visible in a bare-earth DEM, slope map, contours and several hillshades are less likely to be a single display artefact. Persistence is still not proof: the same underlying classification error can flow into every derivative.
Independent reader supportYour contribution helps us test, update, and keep practical guides available for everyone.Why LiDAR can mislead you
Classification and interpolation artefacts
Filtering attempts to classify returns as ground or non-ground, but low or dense vegetation can sometimes be treated as ground. Interpolation then creates a continuous grid from the retained points. Stripes, pits, terraces or unusually smooth patches may reflect acquisition or processing rather than historical activity.
Resolution and point density
Pixel size and point density affect feature visibility, as do vegetation and the scale of the feature itself. There is no universal minimum resolution that exposes every archaeological site. A nominally fine grid can still miss a buried or erased feature, while a broad earthwork may remain legible in coarser data.
Illumination bias
Single-direction hillshade is especially vulnerable to orientation. A bank parallel to the light direction may blend into the background; a gentle slope facing away from the light may look artificially strong. Always compare directions or use additional terrain products.
Best Value

- 50m Long-Range LiDAR Scanning: Capture large indoor and outdoor environments with a powerful 50-meter scanning radius. Ideal for architecture, construction sites, urban streets, warehouses, stadiums, caves, and landscape mapping projects.
- Advanced SLAM for Stable Spatial Capture: Enhanced SLAM algorithms combine point cloud, image, IMU, and GPS data to reduce drift during movement, delivering smoother alignment and more reliable 3D reconstruction results.
- Professional Accuracy with Ultra-Wide FOV: Featuring up to 2cm accuracy and a 360° × 40° ultra-wide field of view, Raven minimizes blind spots and improves single-pass scanning efficiency in complex environments.
- Stunning 4K True-Color Reconstruction: Single 12MP fisheye cameras automatically adapt to lighting conditions to capture vivid 4K imagery, realistic RGB point clouds, and immersive Gaussian Splatting scenes.
- Lightweight Portable Design: Weighing only 1.1kg, Raven is designed for mobile workflows and field operation. Its compact handheld body makes scanning easier across indoor and outdoor job sites.
Topography is not the whole archaeological record
LiDAR primarily reveals surface expression. Buried remains, very low-relief traces, features removed by later land use and archaeology with no measurable topographic signature may not appear. Even high-resolution data can leave genuine remains invisible. Therefore, absence of a visible feature is not proof that a site or past activity was absent.
One modern surface can contain many periods
The mapped ground is contemporary with the survey, but its shapes may have formed at different times and been modified repeatedly. A field boundary can cut across an older platform; a modern track can reuse an earlier route. LiDAR cannot date a feature by itself.
Grounded examples—and what they do not prove
Southern New England woodland traces
A NOAA repository-hosted study uses airborne LiDAR hillshade in southern New England to discuss historical stone walls, building foundations and abandoned roads beneath forest cover. It also notes interpretive traps: some foundations can resemble modern swimming pools, and apparent relief changes with vegetation, processing and resolution. These are regional examples, not a worldwide catalogue of diagnostic shapes.
Free tools Windows power users keep installed
One-click scans. No signup required.
Terrestrial LiDAR at Grand Canyon archaeological sites
A USGS evaluation examined terrestrial LiDAR for collecting topographic data and monitoring geomorphic change at archaeological sites in Grand Canyon National Park, Arizona. That work supports LiDAR’s value for detailed site-scale mapping and repeat monitoring. It does not establish that an airborne hillshade can identify or date every archaeological feature.
Where to get data and which tool to start with
United States
USGS 3DEP provides LiDAR point clouds and elevation products through The National Map. Its services include hillshade, multidirectional hillshade, slope, aspect, contours and elevation-tinted hillshade. The USGS Lidar Explorer provides project information by map location.
Coverage, acquisition date and resolution vary by area. Open the project or layer metadata before drawing conclusions, and record the survey date with any screenshot or feature note.
Outside the United States
Look for the national or regional mapping agency’s elevation-data portal. Product names, licensing, vertical datums, classifications and coverage differ, so apply the same checks: source layer, survey date, resolution, point density, processing notes and available historic context.
Software requirements
An online viewer and public elevation products are enough to learn the basic concepts. More advanced work may require GIS software for filtering, hillshade generation, slope and aspect calculation, contouring, profiles and side-by-side comparison. The key requirement is not a particular brand of software but access to suitable data and the ability to inspect its metadata.
A practical checklist for documenting a candidate feature
- Record the exact location, coordinate system and map scale.
- Save the source layer name, acquisition date and metadata page.
- Note whether the surface is a point cloud, bare-earth DEM/DTM, DSM, intensity image or derivative.
- Write down cell size, point density when supplied, vertical datum and processing or classification notes.
- Capture the feature under more than one hillshade direction and in at least one non-hillshade product.
- Describe its geometry, dimensions, relief, orientation and relationship to slope, drainage and access.
- List archaeological, natural, modern and processing explanations separately.
- Compare historical maps, aerial imagery, environmental records and local land-use history.
- Mark what remains unknown; do not convert uncertainty into a date or identification.
- Seek permission and expert or field validation before visiting, reporting or disturbing a site.
What a LiDAR map can—and cannot—answer
| Question | What LiDAR may support | What it cannot establish alone |
|---|---|---|
| Is there a surface break? | Often, if the relief is large enough for the data and survives processing. | That the break is human-made. |
| Is the feature a bank, ditch or mound? | Relief profiles, slope and contours can describe its form. | Its date, function or cultural affiliation. |
| Was a site occupied? | Associated surface patterns may suggest a candidate for investigation. | Occupation, artefact presence or chronology without independent evidence. |
| Is no archaeology present? | A clear surface may indicate no visible topographic expression in that dataset. | Absence of buried, erased or very subtle remains. |
| Did a feature exist in the past? | Historic comparisons can show persistence or change. | A complete history when records and survey dates are incomplete. |
The most defensible interpretation is therefore layered: describe the measured or rendered surface first, propose competing explanations second, and reserve archaeological identification for conclusions supported by independent context and appropriate validation.
Quick Recap
Product prices and availability are accurate as of the date/time indicated and are subject to change. Any price and availability information displayed on Amazon at the time of purchase will apply.

