Quick wins for a faster PC:
Scan for outdated or missing drivers - takes under a minuteDriver Scan →Repair Windows errors before they cause bigger problemsFix Now →Fix the driver behind crashes, sound loss and screen glitchesFind Drivers →To read an inflation release, first identify the index (usually CPI or PCE), the basket and population it covers, and whether the figures are seasonally adjusted. Then separate the index level from its rate of change, read monthly and year-over-year movements together, and compare headline with core inflation. A higher inflation print can influence interest-rate expectations, real yields, currencies and investor demand, but it does not mechanically predict a higher gold price. Gold can hedge purchasing-power risk in some periods, yet its relationship with CPI varies by horizon and market conditions.
What an inflation number actually measures
An inflation index is a statistical measure of price changes, not a direct reading of how much every household spends. The index combines many goods and services into a weighted basket, sets a reference period, and tracks how the basket’s cost changes over time.
As an Amazon Associate I earn from qualifying purchases.
CPI: prices paid by consumers
The U.S. Bureau of Labor Statistics defines the Consumer Price Index as “a measure of the average change over time in the prices paid by consumers for a representative basket of consumer goods and services.” CPI is designed around spending by consumers in urban areas. It includes categories such as housing, food, energy, transportation, medical care, apparel and recreation. The weights reflect average spending, so an individual household’s inflation can be higher or lower if its budget differs from the national mix. The BLS explains the construction and limitations in its CPI questions and answers.
PC Slower Than It Used to Be?
A free scan shows the junk files, broken settings and background clutter dragging Windows down - then fixes them in one click.Free scan · Windows 10 & 11Crashes, No Sound, or Screen Glitches?
Random freezes, missing sound and display glitches usually trace back to one bad driver. Find and replace yours safely.Free scan · under a minutePCE: a broader household-spending measure
The Personal Consumption Expenditures (PCE) price index, produced by the Bureau of Economic Analysis, measures prices paid by or on behalf of people in the United States. It captures a broader range of household spending, including items paid for by employers, insurers or government programs on a household’s behalf. The Federal Reserve commonly emphasizes PCE and defines its longer-run 2% inflation objective using annual PCE inflation. Its inflation overview is available on the Federal Reserve PCE chart.
#1 Best Overall

- ✔️Each coin contains 1/10 oz of gold.
- ✔️Obverse: Lady Liberty holding a torch with an olive branch.
- ✔️Reverse: The Type 1 reverse, used from 1986-2021, shows a male bald eagle in flight carrying an olive branch to his nest, where a female awaits with her young. The Type 2 reverse, introduced in 2021, shows a bold close-up portrait of an eagle.
- ✔️Each Gold Eagle is a sovereign monetized bullion coin fully guaranteed by the U.S. Mint.
Neither index is universally “best.” CPI is useful for understanding the prices consumers encounter directly and is widely used for contracts and benefit adjustments. PCE is useful for monetary-policy analysis because its scope and weights can adjust as consumers substitute among goods and services. Choose the measure that fits the question rather than treating one release as the single official truth.
Read an inflation release in the right order
1. Identify the index, geography and release date
Start with the title of the release: CPI, core CPI, PCE, core PCE or another index. Confirm that it covers the United States and note the reference month. A release published in October can describe September prices, not October prices. Also check whether the number is preliminary, revised or final. Market commentary often mixes a newly released month with an older annual rate, so write down the exact period before interpreting it.
2. Distinguish the index level from inflation
An index level is a scaled number relative to a base period. It tells you the basket’s position in the index series, but not by itself whether prices are accelerating. Inflation is the percentage change between two observations. For example, an index rising from 300 to 303 represents a 1% increase over that interval, while an index at 303 could still show slowing inflation if the previous interval rose faster. The BLS cautions readers to focus on changes, not to mistake a high accumulated level for a fresh acceleration.
3. Read month-over-month and year-over-year together
A seasonally adjusted month-over-month (m/m) change compares the latest month with the prior month after statistical adjustments for recurring seasonal patterns. It is a timely measure of momentum. A year-over-year (y/y) change compares the latest month with the same month a year earlier. It smooths some short-term noise but depends on the comparison base.
Use both horizons. A low m/m reading can coexist with a high y/y rate if last year’s comparison month was unusually low. Conversely, a high m/m reading may not move the y/y rate much when the base month was already high. Look for several consecutive monthly observations before describing a trend; one month can be distorted by weather, energy prices, medical-service timing or other temporary effects.
4. Check the seasonal-adjustment label
Seasonally adjusted data remove predictable calendar patterns so that current short-term movements are easier to compare. Unadjusted data preserve the actual observed change and are often used for annual comparisons or indexation. Do not compare a seasonally adjusted monthly figure with an unadjusted monthly figure as though they were the same series. The BLS explains why seasonal adjustment helps reveal underlying short-term price movements in its CPI FAQ.
Rank #2

- Our Jewelry is a Beautiful Way to Express Love; Friendship; Beauty and Art. The Right Gift Can Make Someone’s day! Whether the Occasion is a Birthday; Anniversary; Christmas; Black Friday; Cyber Monday or Mother's Day
- Our Collection Includes items for Men or Women and We Offer a Wide Range of beautiful Earrings; Bracelets; Bridal Engagement Rings; and Necklaces for Any Occasion. Our Jewelry Collections are the Perfect Gifts for Mom; Wife; Fiance; Bride; Mother; Father; Groom; Daddy; Daughter; Sister; Brother; Teacher; Employee; Coworker; Friend; Niece; Nephew; Son; Grandmother; Grandfather and More.
- Whether It is For Christmas Gifts or Stocking Stuffers; FB Jewel’s Pieces are Made With the Best Quality Materials Available as Well as Premium Quality Gold; Silver; Tungsten or Titanium for Him and Her. Why Not Treat Your Loved One for Christmas; Valentines Day; Mothers Day; Fathers Day; Graduation; Birthday; Weddings or Anniversary with FB Jewels Solid 22K Yellow Gold 1Oz American Eagle Coin (1.28 x 1.28 Inches)
- All 10K 14K or 18K Gold or 925 Silver are Made with Real Gold or Silver Not Plated
5. Compare headline and core
Headline inflation includes all measured categories, including food and energy. Core inflation excludes food and energy because those prices can swing sharply. Core CPI and core PCE can make broad, persistent pressures easier to see, but they do not describe the full cost of living. Households still pay for groceries, electricity and fuel, and a headline surge can affect expectations even when core is stable.
6. Ask whether the move is broad or concentrated
Read the category table, not only the top-line percentage. A monthly increase driven almost entirely by gasoline has a different implication from a similar increase spread across shelter, services, goods and wages. Broad increases suggest more generalized pressure; a single volatile component may fade. Shelter measurements in CPI also reflect methodological lags, so current housing-market conditions do not always appear immediately in the index.
7. Compare the result with expectations
Financial markets react to the difference between the reported figure and the consensus expected before release. A 0.3% monthly increase can push yields higher if economists expected 0.2%, but have little effect if 0.4% was expected. Expectations are not part of the inflation index itself; they are a market benchmark that helps explain the immediate reaction.
CPI and PCE are different by design
It is normal for CPI and PCE to show different inflation rates. The BEA explains that PCE uses a Fisher-Ideal formula, while CPI uses a modified Laspeyres formula. Their baskets, weights, coverage and treatment of substitutions also differ. A difference is not automatically an error or a sign that one agency measured prices incorrectly. See the BEA CPI-PCE FAQ for the methodological comparison.
| Feature | CPI | PCE |
|---|---|---|
| Primary publisher | U.S. Bureau of Labor Statistics | U.S. Bureau of Economic Analysis |
| Basic coverage | Prices paid by urban consumers for a representative basket | Prices paid by or on behalf of people in the United States |
| Formula | Modified Laspeyres | Fisher-Ideal |
| Typical policy use | Consumer-price and indexation analysis | Federal Reserve’s preferred inflation gauge and 2% longer-run objective |
| Why the rate can differ | Fixed-weight structure and CPI-specific population and item coverage | Broader coverage and weights that reflect changing spending patterns |
What core inflation means—and what it does not
Core inflation is a diagnostic, not a replacement for headline inflation. Removing food and energy reduces the influence of highly volatile prices and can reveal whether price pressure is spreading through other categories. BEA describes the core PCE price index as the PCE measure excluding food and energy and publishes it in the monthly Personal Income and Outlays report on its core PCE page.
What’s actually slowing this PC down?
Pick the symptom - the matching free tool is one click away.
Core can be misleading if used alone. Energy costs feed into transportation, production and household utility bills, while food is a large share of lower-income budgets. A falling core rate does not mean families are paying less for those essentials; it means their prices are excluded from that particular statistic. Read the headline, core, and category details together.
Rank #3
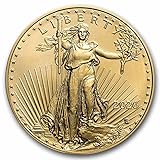
- ✔️Each coin contains 1/10 oz of gold.
- ✔️Obverse: Lady Liberty holding a torch with an olive branch.
- ✔️Reverse: Portrait with an American bald eagle, a design by Jennie Norris in 2021.
- ✔️Each Gold Eagle is a sovereign monetized bullion coin fully guaranteed by the U.S. Mint.
An August 2026 example
The BEA page cited above lists the core PCE year-over-year change at 3.0% for August 2026, 3.0% for July, 3.0% for June and 3.2% for May. Those observations show a modest easing from May followed by stability, not a return to the Federal Reserve’s 2% objective. Because inflation releases are revised and new months supersede old ones, verify the latest BEA table at publication or when making a current decision; the August figure is a dated observation, not a permanent rate.
Why inflation can affect gold
Gold does not pay a coupon, dividend or other contractual income. Its relative appeal therefore depends partly on what investors can earn elsewhere and on how they expect currencies to hold purchasing power. Inflation can increase interest in gold when people seek a scarce store of value or worry that cash and fixed nominal payments will buy less in the future.
The real-yield channel
Markets often respond to inflation by repricing expected central-bank policy and government-bond yields. The relevant comparison for a non-yielding asset is often the real yield—the nominal yield after expected inflation—rather than inflation alone. If inflation rises but policy expectations push real yields sharply higher, holding gold can become more costly relative to interest-bearing assets. If inflation rises while real yields fall or remain negative, the opportunity cost of gold may be lower.
Do these 3 things before closing this tab:
1Repair Windows errors before they cause bigger problems2Scan for outdated or missing drivers - takes under a minute3Clear out junk files and repair common Windows errorsThe currency channel
Gold is quoted internationally, commonly in U.S. dollars. A stronger dollar can make dollar-priced gold more expensive for buyers using other currencies and can weigh on the dollar price; a weaker dollar can have the opposite effect. Inflation data can move the dollar through interest-rate expectations, but the response depends on how U.S. data compare with conditions abroad.
Risk, growth and demand channels
Gold can attract safe-haven demand during financial or geopolitical stress, even when inflation is falling. Strong economic growth can support jewelry and investment demand, while a slowdown can change expectations for rates and risk. Central-bank purchases, exchange-traded investment flows, mine supply and market liquidity also influence prices. The World Gold Council warns that focusing on inflation, interest rates or mining costs alone is too narrow; its broader discussions appear in its inflation-hedge analysis, long-term returns discussion and long-term system overview.
Does higher CPI make gold rise?
No. A higher CPI print is one input, not a mechanical trading signal. The market first asks whether the result beat expectations, whether the increase was broad, and what it implies for policy and real yields. Gold may fall after a high inflation report if investors expect aggressive rate increases and real yields or the dollar rise. It may rise after a moderate report if rate-cut expectations, currency weakness or risk aversion dominate.
Rank #4

- 99.99% Fine Gold; 24K
- Metal Content: 1 Troy Ounce
- Stock Photo; Image is indicative of quality
- Edge: Reeded ; Diameter: 32.70 mm; Thickness 2.95 mm
- You will receive a coin with a year date of our choice from 2006 – Present. Please kindly note that we are unable to accommodate specific year requests
The World Gold Council reports that, since 1971, changes in CPI inflation explained only 16% of the variation in gold prices in its analysis. That statistic describes an historical association over the stated period; it is not a universal causal estimate and does not forecast the next release. A separate 2025 World Gold Council analysis, using U.S.-dollar gold returns and U.S. CPI through December 31, 2024, found that in years when inflation was between 2% and 5%, gold increased 8% per year on average. That conditional average is also historical, not a promise. The two findings use different methods and should not be merged into a single rule.
A practical framework for interpreting an inflation release and gold
- Write down the exact statistic. Record CPI or PCE, headline or core, monthly or annual, seasonally adjusted or unadjusted, reference month and release date.
- Measure the surprise. Compare the result with the market expectation available before publication. A surprise often matters more than the absolute number.
- Inspect breadth. Identify whether shelter, services, goods, food or energy drove the move. Separate volatile components from persistent ones.
- Check momentum. Review at least three monthly changes and the year-over-year rate. Note whether the annual comparison is affected by an unusually high or low base.
- Translate the number into policy expectations. Ask whether traders expect a faster, slower or unchanged path for central-bank rates. Do not assume the same inflation rate always produces the same policy response.
- Watch real yields and the dollar. These variables often change the opportunity cost and international purchasing power of gold more directly than the headline CPI print.
- Assess risk sentiment and flows. Financial stress, geopolitical events, central-bank buying and investment flows can overwhelm the inflation signal.
- Choose a time horizon. A one-day reaction, a multi-month portfolio hedge and a decades-long purchasing-power objective are different tests. State which one you are evaluating.
Gold as an inflation hedge: questions to test
Calling an asset an inflation hedge can mean several different things. Before concluding that gold “works,” specify the test.
| Question | Why it matters for gold |
|---|---|
| Direct CPI linkage | Gold is not contractually indexed to CPI, and the historical relationship is variable. |
| Evaluation horizon | Short-term price reactions can differ from results over a business cycle or decades. |
| Volatility and drawdowns | A long-run gain can coexist with substantial interim declines; inflation protection is not a smooth line. |
| Income versus carrying costs | Gold has no interest or dividend; physical ownership can add dealer spreads, storage and insurance costs. |
| Liquidity and transaction costs | Bars, coins and financial instruments have different spreads, settlement rules and access by country. |
| Sensitivity to real rates, currencies and stress | These forces can strengthen or weaken gold even when inflation is moving in the same direction. |
This framework does not rank alternative inflation responses. It prevents a common mistake: evaluating gold only by asking whether CPI rose during the same month.
Common reading mistakes and how to avoid them
Mistaking a high level for accelerating inflation
Prices can remain high while the rate of increase slows. Use percentage changes over stated intervals rather than the index level alone.
Treating core as the “real” inflation rate
Core is useful for trend analysis, but food and energy remain real expenses. Keep headline inflation in the household-budget picture.
The Tool Desk
Outbyte PC Repair FREERepair Windows errors before they cause bigger problemsFix Now →Outbyte Driver Updater FREEFix the driver behind crashes, sound loss and screen glitchesFind Drivers →Comparing incompatible releases
Do not compare a seasonally adjusted CPI month with an unadjusted PCE month, or a U.S. annual rate with another country’s monthly rate, without labeling the differences.
Best Value

- Purity: .900 Fine Gold
- Metal Content: .1867 Troy Ounces
- Diameter: 21 mm; Thickness: 1.4 mm
- Stock Photo; Image is indicative of quality
- You will receive one coin per purchase
Ignoring revisions and base effects
Historical monthly data can be revised, and year-over-year rates can change because the prior year’s comparison month moves out of the window. Preserve the vintage and reference period when recording an observation.
Assuming the first market move is the lasting move
Bond yields, the dollar and gold can reverse after traders digest category details, revisions or central-bank communication. A release-day price change is evidence of positioning and expectations, not proof of a durable inflation trend.
Using gold as a guaranteed insurance policy
Gold can lose value during periods of high inflation, especially when real yields and the dollar rise. Historical averages describe conditions that have already occurred; they do not remove price, liquidity, storage or tax risks.
Free tools Windows power users keep installed
One-click scans. No signup required.
Where to get reliable inflation data
Use the BLS CPI release and CPI FAQ for definitions, seasonal-adjustment explanations and coverage. Use BEA’s core PCE data page and its CPI-PCE FAQ for PCE observations and methodology. The Federal Reserve’s PCE chart provides policy context. For historical gold relationships, read the World Gold Council analyses at Beyond CPI: Gold as a strategic inflation hedge and its 2025 return analysis, while keeping each study’s period and method separate.
The bottom line for readers
Read the definition before the number: CPI and PCE cover different baskets, index levels are not inflation rates, and monthly momentum can diverge from the year-over-year result. Headline inflation describes the prices households actually face; core inflation helps isolate broader trends but excludes food and energy. Gold may benefit when inflation undermines confidence in currency or when real yields fall, yet higher CPI alone is not a dependable forecast. A disciplined interpretation combines the surprise, breadth, momentum, policy expectations, real yields, the dollar, risk sentiment and your chosen investment horizon.
Quick Recap
Product prices and availability are accurate as of the date/time indicated and are subject to change. Any price and availability information displayed on Amazon at the time of purchase will apply.

