The Tool Desk
Outbyte Driver Updater FREEFix the driver behind crashes, sound loss and screen glitchesFind Drivers →Outbyte PC Repair FREEClear out junk files and repair common Windows errorsFree Scan →Read a transit light curve from the outside inward: establish the out-of-transit baseline, identify ingress, measure the flux drop, inspect the bottom and egress, then compare repeated mid-transit times. The depth mainly gives the planet-to-star radius ratio, while the interval between repeating dips gives the orbital period. Duration and shape add information about geometry, but none of these measurements is reliable until noise, stellar variability and instrumental trends are checked.
What a transit light curve shows
A transit light curve is a time series of a star’s measured brightness. The horizontal axis is time; the vertical axis is flux or relative brightness, often normalized so that the out-of-transit level is close to 1. When a planet passes between the star and the observer, it blocks part of the stellar disk and the plotted brightness falls. NASA summarizes the basic signature simply: “When the exoplanet passes in front of the star, the light curve will show a dip in brightness.”
As an Amazon Associate I earn from qualifying purchases.
The dip is not a photograph of the planet. It is a measurement of how much of the star’s light is missing as the planet crosses the disk. A useful first reading is therefore:
- Vertical change: how much light was blocked.
- Horizontal spacing: how long the event lasted and, when events repeat, how long the orbit takes.
- Edges and curvature: how the planet entered and left the stellar disk and how the star’s brightness varies across its surface.
NASA has found thousands of exoplanets through planetary transits. Space surveys such as TESS monitor much more sky than the original Kepler field; NASA’s 2020 transit explainer describes TESS as covering an area 400 times larger. Ground-based observers can also recover known transits when their images are calibrated and reduced into a differential light curve.
#1 Best Overall

- 【Excellent Optics】Astronomical telescope features 80mm aperture 600mm(f/6.7) focal length-The big aperture can capture more light; high transmission multi-fully coated optical lens can improve light transmittance, reduce the reflection of light. It will bring you more bright and clear images.
- 【Portable & Stable】Our refractor telescope has a backbag, an adjustable aluminum tripod and an upgraded phone adapter. All accessories can be packed into the bag, which is convenient for you to carry and storage for traveling. The tripod is stable and the height can adjust from 17.7" to 52", which is suitable for adults and kids. With the phone adapter, you can take amazing photos through your phone.
- 【Easy to Operate】 This telescope is easy to assemble even for astronomy beginners and kids. You can set up easily with the detail installation manual and video. No tools are required. It’s a great astronomy gift telescope for adults, astronomy enthusiasts, beginners and kids 8-12.
- 【Optimum Magnification】Our telescope for kids and adults is equipped with two replaceable excellent-quality eyepiecesa (20mm and 9mm) for 30X and 66X magnification. A moon filter transmits only 13 percent of the incoming light and improving contrast. Also with 5x24 finderscope, you can locate objects easily. A great option for astronomy lovers to explore the moon, Saturn and Jupiter.
- 【Satisfaction Service】We provide 3 years satisfaction service. If you have any questions about the product and service, please feel free to contact us to get 24-hour technical support from our expert team. Whether observing moon or viewing planets, our telescope can meet your all needs. It’s a great telescope for adults & 8-12 kids & astronomy beginners.
Read the graph in the right order
1. Establish the out-of-transit baseline
Start with the star’s brightness before ingress and after egress. These out-of-transit points define the reference level against which the dip is measured. In an ideal plot the baseline is horizontal and nearly smooth. Real observations often show scatter, a gradual slope or low-frequency curvature.
A drifting baseline can arise from changing atmospheric transparency, telescope focus, detector response, an unsuitable comparison star, or genuine stellar variability. A flare, starspot pattern or other stellar change can also alter the apparent level. Model or detrend such behavior before interpreting a small planetary signal. Detrending should remove a demonstrable systematic without flattening the transit itself.
Check whether the comparison stars used to make a relative light curve show the same trend. A feature shared by several stars is more likely instrumental or atmospheric than planetary. A feature present only in the target may be astrophysical, but it still needs a transit-shaped, repeatable signal for confidence.
Crashes, No Sound, or Screen Glitches?
Random freezes, missing sound and display glitches usually trace back to one bad driver. Find and replace yours safely.Free scan · under a minuteWindows Errors? Fix Them Before They Spread
Repair common Windows errors and clear accumulated junk for a smoother, more stable PC - no reinstall needed.Free scan · no reinstall2. Mark ingress
Ingress is the initial decline as the planet begins crossing the stellar disk. In the standard contact nomenclature, ingress runs from first contact (I), when the planetary disk first touches the stellar limb, to second contact (II), when the planet is fully inside the disk. The slope is the rate at which the observed flux falls during this interval.
A sharp edge usually means the observations resolve the crossing well. A rounded or poorly defined edge can result from long exposures, sparse cadence, noise, limb darkening or a grazing geometry. Do not estimate a slope from one or two noisy points; use a fitted model and the time stamps of the observations.
3. Measure the transit depth
Transit depth is the difference between the baseline flux and the lowest in-transit flux, expressed relative to the baseline. If the normalized baseline is 1.000 and the bottom is 0.998, the depth is approximately 0.002, or 0.2 percent. NASA defines depth as the ratio of planet area to star area in the simplified interpretation and gives a depth of 0.2 as 20 percent of the star’s brightness being blocked.
For a small planet crossing a uniformly bright stellar disk, the usual approximation is:
δ ≈ (Rp/R★)²
Here δ is the fractional depth, Rp is planetary radius and R★ is stellar radius. Rearranging gives:
Rank #2

- Superior Optics: 400mm(f/5.7) focal length and 70mm aperture, fully coated optics glass lens with high transmission coatings creates stunning images and protect your eyes. Perfect full positive telescope for astronomers to explore stars and moon.
- Magnification: Come with two replaceable eyepieces and one 3x Barlow lens.3x Barlow lens trebles the magnifying power of each eyepiece. 5x24 finder scope with mounting bracket and cross-hair lines inside make locating objects easily.
- Wireless Remote: This refractor telescope includes one smart phone adapter and one Wireless camera remote to explore the nature of the world easily through the screen and take amazing celestial images.
- Adjustable Tripod: This telescope allows for many different viewing positions with a adjustable aluminum alloy tripod and a carry bag, the telescope and tripod can fit inside the bag for easy traveling and storage.
- Satisfaction: Buy with confidence from a leading manufacturer.
Rp ≈ R★ × √δ
Thus a 1 percent depth corresponds to a planet-to-star radius ratio of about 0.1 under the simplified assumptions. The calculation does not directly yield kilometres or Earth radii until the host-star radius is known.
The shortcut has important limits:
- Limb darkening: the stellar edge is dimmer than the center, so the same planet can produce different flux changes at different positions on the disk.
- Geometry: a non-central or grazing crossing changes the portion of the disk covered and the detailed shape of the dip.
- Dilution: light from an unresolved companion or nearby field stars makes the measured dip shallower than the undiluted transit.
- Stellar radius: uncertainty in the host-star radius transfers directly into uncertainty in the planet’s radius.
- Systematics: poor comparison stars, changing sky conditions, detrending and correlated noise can bias the measured depth.
“Larger planets block out more light,” as NASA’s transit-light-curve explanation puts it, but a deeper dip means a larger planet only when the host-star radius, dilution and observing setup are comparable.
4. Inspect the in-transit bottom
After ingress, determine whether the curve reaches a flat or gently curved bottom. A flat section indicates that the planet is fully across the stellar disk for part of the event. A gentle curve is expected when limb darkening is important or when the path is near-grazing. A V-shaped profile often signals a grazing or nearly grazing transit, although noise and inadequate cadence can make a normal transit look V-shaped.
Quick wins for a faster PC:
Scan for outdated or missing drivers - takes under a minuteDriver Scan →Repair Windows errors before they cause bigger problemsFix Now →Fix the driver behind crashes, sound loss and screen glitchesFind Drivers →The bottom should be evaluated relative to the local baseline, not an arbitrary zero on the plot. Compare several points around minimum light, because a single lowest pixel or exposure can be an outlier.
5. Measure duration and egress
Total transit duration runs from the start of ingress through the end of egress. NASA’s Exoplanet Watch material notes that events commonly last several hours, but the exact duration depends on the system and viewing geometry.
Egress is the recovery as the planet leaves the disk, from third contact (III) to fourth contact (IV). In a clean, symmetric transit, ingress and egress have similar durations. Asymmetry can indicate a grazing path, an incorrect baseline, stellar activity, a nearby contaminating source or timing and cadence problems.
Duration combines the stellar radius, orbital speed, impact parameter (how far the track passes from the stellar center) and orbital geometry. A long event is not automatically a long-period orbit: a large star, a slower orbital speed or a central crossing can all lengthen it. Conversely, a short event may be caused by a small star, a fast orbit or a high-impact-parameter path.
6. Check whether the dip repeats
Fold or align observations from different nights on a common time system and search for dips with consistent mid-transit times. The interval between successive mid-transit centers is the orbital period. If mid-transit times occur at 2.3 days, 4.6 days and 6.9 days after a reference event, the approximately 2.3-day spacing is the period, subject to timing uncertainty.
Rank #3
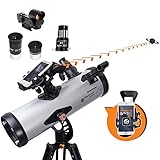
- SMARTPHONE-POWERED SKY TOUR: No experience needed! Just dock your phone, launch the StarSense Explorer app, and follow the on-screen arrows to locate stars, planets, nebulae, and more.
- PATENTED STARSENSE TECHNOLOGY: Unlike other astronomy apps, StarSense Explorer uses sky recognition technology to turn your phone into a celestial navigation system, analyzing star patterns overhead to pinpoint your telescope’s position.
- TONIGHT’S BEST TARGETS, INSTANTLY: The app generates a curated list of the top objects to see based on your time and location. See planets, bright nebulae, galaxies, and star clusters from the city—and even more from dark skies.
- SIMPLE SETUP, SMOOTH TRACKING: Features a manual altazimuth mount with altitude slow motion adjustment with a sliding rod. Follow the on-screen arrows to your target; when the bullseye turns green, you can view it clearly through the eyepiece.
- 114MM REFLECTOR WITH IMPRESSIVE VIEWS: The 4.5" Newtonian reflector with high-reflectivity coatings delivers sharp, vivid views of the Moon, planets like Jupiter and Saturn, and deep-sky favorites like the Orion Nebula and Andromeda Galaxy.
One dip establishes a candidate event, not a secure period. A single observation cannot distinguish the true period from an integer multiple, an instrumental event or an unrelated stellar fluctuation. Confirm that the same depth and transit-shaped profile recur at the predicted times, preferably with observations that include the full baseline, ingress and egress.
The amount of dimming constrains relative planet size, while the time required to orbit once constrains the period. Orbital size can then be inferred only with additional system information and an orbital model; the gap between dips alone is the period, not a direct measurement of the planet’s orbital radius.
What each visible feature constrains
| Light-curve feature | Primary information | What can mislead you |
|---|---|---|
| Depth, δ | Planet-to-star radius ratio; approximately (Rp/R★)² for a small planet and uniform disk | Limb darkening, dilution, stellar-radius uncertainty, detrending and noise |
| Total duration | Combination of stellar radius, orbital speed, impact parameter and geometry | Duration alone does not uniquely determine planet size or period |
| Ingress and egress duration | Transit geometry and radius ratio when cadence is adequate | Long exposures, sparse sampling, grazing paths and models that omit limb darkening |
| Interval between repeated mid-transit times | Orbital period | One dip is insufficient; missed events can make an apparent interval an integer multiple of the true period |
| Baseline scatter or drift | Measurement quality and possible stellar or instrumental variability | Do not interpret every fluctuation as a planetary signal |
How to measure a curve from your own observations
Prepare calibrated images
Start with bias, dark and flat-field calibration, then perform aperture photometry on the target and several comparison stars. Use the same aperture strategy throughout the sequence and record exact observation times. A sky annulus around each aperture helps estimate and subtract the background.
Do these 3 things before closing this tab:
1Fix the driver behind crashes, sound loss and screen glitches2Repair Windows errors before they cause bigger problems3Scan for outdated or missing drivers - takes under a minuteChoose comparison stars that are unsaturated, isolated, similar in color and close enough in the field to share atmospheric effects. Reject a comparison star if it is variable, blended or affected by a detector defect. Form a differential light curve from the target relative to the stable comparison ensemble.
Use NASA’s EXOTIC workflow
NASA Exoplanet Watch recommends EXOTIC for turning calibrated images into a transit light curve. EXOTIC is a free Python 3 package that can run locally on Windows, macOS and Linux/Unix, and it is also available through a Google Colab workflow. Its functions include calibrating flats, darks and biases; selecting comparison stars, aperture and sky annulus; and fitting a transit model that reports transit depth and mid-transit time.
- Install or open EXOTIC. Use the local Python 3 package on a supported desktop operating system or launch the Google Colab workflow.
- Load the observing data. Provide the calibrated image sequence, target coordinates and the correct time information for every exposure.
- Define photometry settings. Select the target, comparison stars, aperture size and sky annulus. Inspect several frames to ensure the apertures remain on the stars.
- Review the differential curve. Look for a stable out-of-transit level, obvious outliers, drift and comparison-star problems before fitting.
- Fit the transit model. Examine the fitted depth, mid-transit time, uncertainties and residuals. A model that includes limb darkening is preferable for precision work.
- Validate the result. Check that residuals do not contain a transit-shaped feature, that the baseline is represented adequately and that the fitted event agrees with independent observations.
The software produces a measurement; it does not turn a marginal, poorly sampled dip into a confirmed planet. Keep the raw images, calibration frames, comparison-star choices and detrending settings so the result can be reproduced.
How model assumptions change the reading
Limb darkening
A star is generally brighter near its center and dimmer toward its edge. As the planet moves across these regions, the blocked flux changes even when the planet’s area is constant. Limb darkening rounds the ingress and egress and can make the bottom gently curved. NASA’s Transit Least Squares description explicitly includes limb darkening and ingress/egress in its transit models.
Recommended Free Tools
For a quick visual estimate, the area-ratio formula is useful. For a radius, impact parameter or timing measurement intended for publication, fit a physical transit model with appropriate limb-darkening parameters rather than reading the lowest point by eye.
Rank #4

- Superior Optics: Dianfan astronomy telescope features a focal length of 800 mm and a fully coated 90 mm objective lens. The large aperture gathers more light for brighter, clearer views, high-transmission coatings enhance contrast and color for sharp, vivid images for an enjoyable stargazing experience
- Powerful Magnification: With two eyepieces and a 3× Barlow lens, this telescope offers 32×–240× magnification. It allows you to observe craters and lunar seas on the surface of the Moon. With the 45° zenith mirror, images are upright and correctly oriented for terrestrial viewing, making distant targets details easier to observe. The telescope is ideal for beginners and astronomy enthusiasts
- Quick Setup & Beginner-Friendly: User-friendly design with clear instructions makes assembly simple—ready in about 15 minutes. Smooth focusing helps you quickly locate targets. Perfect for families to enjoy stargazing and explore the night sky together
- Portable & Versatile: Lightweight design with a sturdy stainless steel tripod ensures stable, steady viewing. Easy to carry in the included bag, making it perfect for travel and outdoor adventures. Suitable for stargazing, birdwatching, wildlife observation, and exploring cityscapes
- Professional Astronomical Telescope: The Dianfan 90x800 telescope combines quality , functionality and reliability. It delivers high-resolution views that bring the universe closer. Designed for adults high powered, it inspires interest in astronomy and science while encouraging exploration of the starry sky
Impact parameter and grazing geometry
The impact parameter describes how far the planet’s track passes from the stellar center in units related to stellar radius. A central path generally has a longer, flatter full-transit section. A high-impact-parameter path spends less time fully inside the disk and can produce a rounded or V-shaped profile. Because geometry affects both duration and shape, depth alone should not be used to infer a planet radius when the transit is grazing.
Finite exposure time and cadence
Each exposure averages the star’s brightness over its integration time. If the exposure is long compared with ingress or egress, the recorded edge is smeared and the transit appears shallower or less sharply defined. Sparse cadence can miss contact points entirely. Record the cadence and exposure time, and use a model that accounts for exposure integration when the edges are important.
Stellar activity and correlated noise
Starspots can alter the baseline or create anomalies during a transit; flares can produce abrupt upward excursions. Atmospheric changes, guiding errors and detector effects may create noise that is correlated from one exposure to the next. Random scatter can be reduced with more data, but correlated noise requires diagnostics, a better observing setup or a noise model. No universal numerical uncertainty threshold establishes a detection from these plots alone; credibility comes from the complete light curve, model fit, residuals and repeatability.
Free tools Windows power users keep installed
One-click scans. No signup required.
Comparing two curves or candidate planets
When two plots are presented, do not choose the deeper or longer-looking event immediately. Compare them in this order:
- Signal-to-noise and baseline stability: determine whether the dip stands above the out-of-transit scatter and whether the baseline is flat enough to support a depth measurement.
- Repeatability: check whether predicted future events recur at a consistent period and mid-transit time.
- Depth: compare fractional depth only when host-star radii and contaminating light are comparable or corrected.
- Ingress and egress: assess whether the edges are resolved and physically consistent rather than single-point jumps.
- Total duration: interpret it with stellar radius and impact parameter, not as a stand-alone period or size indicator.
- Cadence and exposure time: favor the curve that samples the event adequately, especially both contacts.
- Model completeness: verify that the fit includes limb darkening and reports residuals and uncertainties.
NASA’s Transit Least Squares work reports approximately 10 percent higher detection efficiency than Box-Least Squares at similar false-alarm rates. That statistic describes a detection algorithm comparison, not a guarantee that any individual dip is planetary. A robust candidate still needs a physically plausible shape, a stable baseline and repeat observations.
Common reading errors and fixes
Calling every dip a planet
Symptom: a one-night downward fluctuation is labeled an exoplanet.
Fix: require a transit-shaped event with a measured baseline, resolved or modeled contacts and recurrence at a consistent period. Inspect comparison stars and residuals for the same feature.
Using the raw lowest point as the depth
Symptom: one noisy exposure determines the planet radius.
Best Value

- BRIGHT, SHARP VIEWS ANYWHERE: Unlike many beginner telescopes, this quality refractor features fully coated glass lenses and a 70mm aperture for crisp, clear views of the Moon, planets, and daytime scenery—all in a lightweight, travel-ready design.
- PERFECT FIRST TELESCOPE FOR BEGINNERS: Designed for adults and kids to enjoy together, this beginner-friendly telescope sets up in minutes and delivers rewarding views with no prior experience required.
- EASY NO-TOOL SETUP: No complicated assembly or tools needed. The full-height tripod and telescope tube set up in seconds and pack neatly into the included backpack—so you’re always ready to observe on the go.
- DUAL EYEPIECES FOR VERSATILE VIEWS: Includes 20mm and 10mm eyepieces for wide and close-up views of celestial and terrestrial targets. Spot craters on the Moon at night or wildlife during the day.
- BONUS BACKPACK AND SOFTWARE: Includes a padded backpack with room for accessories, a finderscope, star diagonal, eyepieces, and a free download of Starry Night software to help you identify celestial objects and plan your next stargazing session.
Fix: fit the full event, estimate the baseline from out-of-transit data and report uncertainty. Include limb darkening and exposure integration when precision matters.
Equating a deeper dip with a larger planet
Symptom: two candidates are ranked by depth alone.
Fix: compare host-star radius, dilution, geometry and baseline quality. A small planet around a small star can produce a deeper fractional transit than a larger planet around a much larger star.
Equating a longer dip with a longer period
Symptom: event duration is treated as the orbital period.
Fix: measure the interval between repeated mid-transit times for the period. Use duration only as a constraint on speed, stellar size and geometry.
Ignoring a sloping baseline
Symptom: the apparent transit depth changes depending on which points are called “before” and “after.”
Fix: investigate atmosphere, focus, guiding, detector behavior, comparison stars and stellar variability. Apply a justified detrending model and check that the inferred depth is not driven by the detrending choice.
Overlooking missing contacts
Symptom: the observation starts after ingress or ends before egress.
What’s actually slowing this PC down?
Pick the symptom - the matching free tool is one click away.
Fix: treat duration and timing as weakly constrained, schedule longer coverage next time and avoid claiming a complete transit from partial data.
A compact checklist for interpreting any plotted curve
- Is the time axis correctly labeled and on a consistent time system?
- Where is the out-of-transit baseline, and is it stable on both sides?
- Can first and fourth contact be identified or modeled?
- What is the fractional depth relative to the local baseline?
- Is the bottom flat, curved or V-shaped, and could limb darkening or grazing geometry explain it?
- Are ingress and egress sampled by enough exposures?
- What is the total duration, and which stellar and orbital parameters also affect it?
- Do independent events repeat at a consistent mid-transit interval?
- Could dilution, spots, flares, comparison-star choice or correlated noise mimic the signal?
- Does the fitted model include limb darkening, exposure integration, uncertainties and residual checks?
What you can and cannot conclude from one light curve
A well-calibrated, repeatable transit curve can constrain the planet-to-star radius ratio, transit timing and aspects of the orbital geometry. Combining the radius ratio with an independently measured stellar radius gives a planetary-radius estimate. Repeated mid-transit times give the orbital period.
A single noisy dip cannot by itself establish a planet, a unique period, an absolute planetary radius or an orbital distance. Those conclusions require a suitable host-star characterization, adequate sampling, a model that reflects the observing conditions and confirmation that the signal is not caused by stellar or instrumental variability.
Quick Recap
Product prices and availability are accurate as of the date/time indicated and are subject to change. Any price and availability information displayed on Amazon at the time of purchase will apply.

