What’s actually slowing this PC down?
Pick the symptom - the matching free tool is one click away.
Plan a high-capacity SSD deployment as a complete server-and-rack system, not as a stack of drives. Start with usable capacity and workload requirements, then select a precise drive SKU and compatible chassis. From that configuration, calculate installed drive power, add hosts, networking, management equipment, and power-conversion losses, and compare the resulting rack load with the facility’s electrical, cooling, airflow, weight, and service-access limits.
Vendor figures illustrate the scale but do not determine your final design. For example, Micron reports that its 61.44TB 6550 ION delivers 12GB/s using 20W; that is a manufacturer statement for one product configuration, not a universal SSD power rating. The final rack count and cooling requirement depend on the exact drive population, enclosure, workload, power supplies, network fabric, and site conditions.
As an Amazon Associate I earn from qualifying purchases.
What a defensible SSD rack plan must contain
A useful estimate has four linked outputs:
- Usable capacity: the capacity available to applications after reserves, protection, formatting, and any applicable data-reduction assumptions.
- IT electrical load: drives plus servers, storage enclosures, networking, management hardware, and power-supply conversion losses.
- Heat and airflow requirement: the facility-engineering value derived from the actual IT load and the site’s supply, return, containment, and temperature limits.
- Physical density: drive slots, chassis rack units, power distribution, cabling, weight, service clearances, and the number of systems that can be installed without exceeding rack or room limits.
Do not approve a design from a drive data sheet alone. The same SSD can produce a different rack result when installed in a different host, backplane, population level, workload, or airflow path.
1. Define workload and usable capacity before choosing a drive
Capture application requirements
Write down the requirements that determine both the number of drives and their operating state:
#1 Best Overall

- Compatibility: 2.5-Inch form factor size for capacity-dense storage, SATA III 6G interface
- Performance: storage space of 7680GB, qlc NAND flash Type for endurance & Performance
- Applications: real-time analytics, big data, AI data lakes, machine and deep learning
- Features: AES 256-bit encryption, power Loss protection, end-to-end data path protection
- Reliability: 24x7 availability, long-term lifespan, full Micron Warranty can be claimed through point of purchase
- Raw capacity and usable capacity targets.
- Expected data growth and the planning horizon.
- Read/write mix, block size, queue depth, throughput, and latency targets.
- Redundancy, spare-drive policy, rebuild objectives, and failure-domain layout.
- Data-reduction assumptions, if compression or deduplication is part of the design.
- Endurance requirements, including expected writes per day and retention or refresh policy.
There is no universal workload model for “high-capacity SSD.” A mostly sequential archive, a mixed OLTP database, and a training-data repository can require very different performance, endurance, thermal, and spare-capacity margins even when their usable-terabyte targets are identical.
Separate raw, protected, and usable capacity
Use an explicit worksheet rather than treating the advertised capacity of each drive as usable storage:
- Multiply the selected drive capacity by the number of installed drives to obtain raw capacity.
- Subtract or reserve the capacity required for parity, mirroring, erasure coding, metadata, hot spares, and rebuild headroom.
- Apply a data-reduction factor only when the application has evidence to support it. Keep the unreduced figure visible so a favorable assumption cannot hide a shortfall.
- Compare the resulting usable capacity with the growth-adjusted requirement, not today’s data volume.
For procurement, record the exact capacity designation and unit convention used by the vendor and the storage software. A “60TB-class” product label and a 61.44TB stated capacity describe the same product family at different levels of precision; your bill of materials should use the exact SKU value.
2. Select the exact SSD SKU and verify the host platform
Form factor is a system constraint
Drive form factors are not interchangeable simply because they use a similar protocol. Micron lists the 6550 ION in E3.S, U.2, and E1.L variants. Its 6600 ION product line spans E3.S and E3.L. Each variant requires a compatible server bay, backplane, carrier, power connection, cooling path, and firmware support.
Before pricing drives, obtain the server or enclosure bill of materials and confirm:
- Physical bay type and carrier specification.
- Number of populated slots and any restrictions on mixed drive lengths or heights.
- Interface and link-speed support from the backplane, host bus adapters, and CPUs.
- Firmware, qualification, and hot-plug support for the selected SKU.
- Per-slot power delivery and the chassis power-supply configuration.
- Front-to-back or other intended airflow direction, including blanking panels and ducting.
- Service clearance and the procedure for replacing a drive in the proposed rack position.
Reference products and what their published figures mean
| Product or family | Published capacity or density figure | Published power or performance figure | Form factors mentioned | How to use the figure |
|---|---|---|---|---|
| Micron 6550 ION | 61.44TB; described by Micron as a 60TB-class drive | 12GB/s using 20W in Micron’s November 12, 2024 announcement | E3.S, U.2, E1.L | Use only for the applicable configuration and workload; the power and performance statement is a manufacturer claim, not an independent benchmark. |
| Micron 6600 ION | More than 2.4PB per rack unit for E3.S; more than 4.9PB per rack unit for E3.L | Not stated in the cited product-page figure | E3.S, E3.L | Treat the density values as Micron’s rack and configuration claims, then reproduce the underlying drive-count, chassis, and rack assumptions before using them in a design. |
| Solidigm D5-P5336 | Up to 122.88TB | Not stated in the cited product-page figure | Not stated in the cited figure | Confirm the exact form factor, power envelope, endurance, and host qualification for the SKU under consideration. |
Micron also presents an “up to 67% greater rack density” comparison for the 6550 ION. That is a vendor comparison dependent on the configurations being compared; it is not a promise that every rack will gain 67% capacity.
3. Build the electrical power budget
Start with drive-level states, not a single optimistic wattage
Identify the vendor’s values for active, idle, standby, startup, and any throttled or thermal-limited states for the exact SKU. If the vendor publishes only one operating-state figure, label it accordingly rather than presenting it as a full power profile.
Recommended Free Tools
Micron’s 6550 ION announcement says the 61.44TB product achieves 12GB/s while using 20W. The statement is useful as a reference point for that product positioning, but it does not establish the idle draw, peak draw, startup surge, or power of another 6550 variant. Obtain those values from the selected model’s specification and platform documentation.
Calculate the installed-drive subtotal
For each operating state, calculate:
drive subtotal = number of installed drives × applicable watts per drive
Rank #2

- Matched Pair of Xeon Gold 6130 16-Core 2.10 GHz, 22.0 MB L3 Cache, Up To 3.70 GHz Turbo, TDP: 125W
- Memory: 512GB (16 x 32GB) DDR4-2666MHz PC4-21300 ECC Memory
- Storage: 61.44TB (8 x 7.68TB) Enterprise Micron SATA III 6Gb/s SSDs for Ultra-Fast Storage
- Thermal Paste included
- Compatible with ThinkSystem SR530, SR630, SR650, ST550
Keep separate rows for normal active load, expected idle load, background rebuilds, and any high-write or performance-test condition that the facility must support. A rack that looks acceptable at idle can exceed its electrical or thermal envelope during rebuilds or sustained writes.
Add every other IT load
The rack estimate must include:
- Storage servers or JBOD/enclosure electronics.
- CPUs, memory, host bus adapters, and local boot devices.
- Network switches, optics, and fabric adapters.
- Management controllers and monitoring equipment.
- Power-distribution units and other in-rack electrical devices.
- Power-supply and voltage-conversion losses.
Use the host and enclosure documentation for those values. Do not multiply an SSD’s wattage by the drive count and call the result rack power.
Do these 3 things before closing this tab:
1Repair Windows errors before they cause bigger problems2Scan for outdated or missing drivers - takes under a minute3Clear out junk files and repair common Windows errorsIllustrative arithmetic using the 20W reference
Suppose a planning worksheet temporarily models 24 drives at the 20W figure quoted for the 6550 ION announcement:
24 × 20W = 480W drive-level subtotal
That 480W is only the modeled drive subtotal. It excludes the server, backplane, fans, memory, processors, network equipment, management hardware, and conversion losses. It is therefore not a 480W rack estimate and should not be used as a cooling set point. Replace the reference value with the exact SKU’s applicable active and idle data before purchasing equipment.
Account for power delivery and redundancy
Document the number and rating of power supplies, their input voltage, phase, circuit allocation, and redundancy mode. A two-feed design can improve availability while still leaving less usable capacity per feed if the rack must survive a failed circuit or power-supply group. Check both normal operation and the required failure case, and leave the site’s mandated reserve margin intact.
4. Convert IT load into a cooling and airflow requirement
Treat IT electrical load as heat to be rejected
For facility planning, the electrical energy consumed by IT equipment becomes heat that the cooling system must remove. Use the data center’s approved engineering method and the equipment manufacturer’s thermal data to translate the calculated load into supply-air, return-air, chilled-water, refrigerant, or other cooling requirements.
The calculation must reflect the actual installation:
- Supply-air temperature and humidity limits.
- Return-air temperature and allowable component temperature rise.
- Hot-aisle or cold-aisle containment and leakage paths.
- Rack orientation, neighboring equipment, and obstructions.
- Altitude and ambient conditions.
- Fan-control behavior and any drive or chassis thermal throttling.
- Cooling redundancy and the required failure scenario.
Do not turn a drive-level wattage into a room cooling number without adding the rest of the IT load and applying the facility’s design conditions.
Use airflow figures only in their stated context
NVIDIA’s DGX H100 planning guidance cites a minimum airflow example of 157ft³/min (4.445m³/min) per kilowatt for that design. NVIDIA also states that the requirement changes with environmental conditions, altitude, and component temperature rise. This is a system-specific reference, not a universal airflow constant for a high-capacity SSD rack.
Rank #3
- Storage Capacity: 3.84 TB
- Encryption Standard: 256-bit
- Maximum read transfer rate: 540 MB/s
- Maximum write transfer rate: 350 MB/s
- Endurance (DWPD): 0.8
If you use that figure as a sanity check, label it as the DGX H100 example and compare it with the airflow capability and pressure drop of the actual SSD chassis, rack, containment, and room cooling units. The final value must come from the site’s thermal design and the installed equipment’s requirements.
The Tool Desk
Outbyte PC Repair FREERepair Windows errors before they cause bigger problemsFix Now →Outbyte Driver Updater FREEScan for outdated or missing drivers - takes under a minuteDriver Scan →Check for airflow bottlenecks
High-capacity drives can be physically small while the host system, fan wall, cabling, and blanking panels determine whether air reaches them. Inspect:
- Blocked or partially populated front bays.
- Missing blanking panels that allow air to bypass the equipment.
- Cable bundles crossing inlet or exhaust paths.
- Backplane and carrier pressure-drop limits.
- Uneven loading between racks or between the top and bottom of one rack.
- Hot exhaust recirculating into an adjacent inlet.
Require the platform owner to state the allowable inlet temperature and the expected component temperature rise at the planned population. A rack can have adequate room-level cooling and still overheat a drive bay because of a local airflow obstruction.
5. Calculate rack density from the real chassis configuration
Count slots, systems, and rack units
Determine how many drives fit in one qualified chassis, how many chassis fit in the proposed rack, and how much rack-unit space remains for switches, patch panels, cable management, and service clearance. The relevant density is usable capacity per occupied rack unit, not advertised capacity per drive.
Use this sequence:
- Record drive capacity and the number of populated slots per chassis.
- Calculate raw and usable capacity for one chassis.
- Record chassis rack units, power supplies, network equipment, and any required shelves.
- Lay out the rack positions, including vertical PDUs, cable paths, and access space.
- Multiply by the number of systems that fit while respecting weight, power, and airflow limits.
- Divide usable capacity by occupied rack units to obtain the deployment’s actual capacity density.
Interpret vendor petabyte-per-rack-unit claims correctly
Micron’s 6600 ION page reports more than 2.4PB per rack unit for E3.S and more than 4.9PB per rack unit for E3.L. Those are manufacturer figures tied to particular drive counts, chassis, and rack assumptions. They are useful for comparing form-factor potential, but they are not guaranteed outcomes for every server, enclosure, or facility. Reproduce the assumptions before comparing them with your own design.
Windows Errors? Fix Them Before They Spread
Repair common Windows errors and clear accumulated junk for a smoother, more stable PC - no reinstall needed.Free scan · no reinstallCrashes, No Sound, or Screen Glitches?
Random freezes, missing sound and display glitches usually trace back to one bad driver. Find and replace yours safely.Free scan · under a minuteA denser drive format can reduce the rack units needed for a target capacity, yet the resulting rack may still be limited by watts, airflow, network bandwidth, weight, or maintenance access. If the site cannot support the theoretical density, spreading the same capacity across more racks may be the correct engineering decision.
Include serviceability and connected infrastructure
Reserve space and access for drive replacement, controller work, fiber and copper bend radii, labeling, and safe removal of a chassis. Include top-of-rack or end-of-row switches, optics, patching, and management connections in the layout. A design that fits only when cables, PDUs, or a technician’s working clearance are omitted is not a deployable rack plan.
6. Compare candidate configurations on the same axes
Build a comparison matrix using identical workload and facility assumptions. At minimum, compare:
| Decision axis | Questions to answer |
|---|---|
| Capacity | What is the exact per-drive capacity, raw chassis capacity, protected usable capacity, and growth margin? |
| Performance | Does the drive meet throughput, latency, queue-depth, and mixed read/write targets in the intended host? |
| Endurance | Does its rated endurance match the workload, rebuild pattern, and retention policy? |
| Power | What are active, idle, startup, and worst-case values for the exact SKU and population? |
| Platform compatibility | Is the E3.S, E3.L, U.2, or E1.L variant supported by the backplane, carrier, firmware, and power delivery? |
| System density | How many drives and systems fit per chassis and rack after switches, PDUs, cables, and service clearances? |
| Thermals | What inlet temperature, airflow, pressure drop, and component temperature rise does the platform require? |
| Operations | Can technicians replace drives safely, and can the design tolerate a failed feed, fan group, or power supply? |
Do not rank options by petabytes per rack unit alone. A lower-density arrangement may deliver better availability, simpler airflow, or enough power margin to avoid throttling.
Rank #4

- Storage Capacity: 7.68 TB
- Encryption Standard: 256-bit
- Maximum read transfer rate: 540 MB/s
- Maximum write transfer rate: 360 MB/s
- Endurance (DWPD): 0.8
7. A practical planning worksheet
Create one row for each proposed chassis and one summary row for each rack. The following fields expose missing assumptions early:
| Worksheet field | Entry to record |
|---|---|
| Drive identity | Vendor, exact model, capacity, firmware, form factor, interface, and qualification status. |
| Population | Installed drives, reserved slots, hot spares, and maximum supported population. |
| Capacity | Raw, protected, usable, and growth-adjusted capacity. |
| Workload | Read/write mix, throughput, latency, queue depth, endurance, and rebuild assumptions. |
| Drive power | Active, idle, startup, rebuild, and throttled-state values with their source and conditions. |
| System power | Host, memory, processors, fans, backplane, adapters, switches, management, and conversion losses. |
| Rack layout | Chassis rack units, systems per rack, PDUs, cable paths, switch positions, weight, and service clearance. |
| Thermal design | Inlet and return conditions, airflow direction, containment, temperature rise, altitude, and cooling redundancy. |
| Facility limits | Available power per rack and feed, allowable heat load, airflow capability, floor loading, and expansion margin. |
Mark every value as measured, vendor-published, calculated, or an assumption. That classification makes it clear which numbers must be confirmed during platform qualification or a site survey.
Independent reader supportYour contribution helps us test, update, and keep practical guides available for everyone.8. Common planning failures and how to correct them
Using advertised drive watts as rack power
Symptom: The spreadsheet multiplies drive count by one wattage and compares that number with the rack circuit.
Correction: Add hosts, fans, memory, networking, management, PDUs, and conversion losses. Model normal, peak, startup, and failure conditions separately.
Free tools Windows power users keep installed
One-click scans. No signup required.
Assuming every variant fits the same bay
Symptom: An E3.S, E3.L, U.2, or E1.L product is selected after the chassis has already been specified.
Correction: Lock the form factor and backplane together in the bill of materials. Verify carrier, connector, firmware, power, and airflow compatibility before ordering.
Copying a vendor density claim into a site capacity plan
Symptom: A petabyte-per-rack-unit or percentage-density claim is treated as a guaranteed rack result.
Correction: Recreate the cited drive count, chassis, rack-unit, and power assumptions. Recalculate using your own usable-capacity, redundancy, network, and service-clearance requirements.
Quick wins for a faster PC:
Repair Windows errors before they cause bigger problemsFix Now →Scan for outdated or missing drivers - takes under a minuteDriver Scan →Clear out junk files and repair common Windows errorsFree Scan →Applying a system-specific airflow number universally
Symptom: The 157ft³/min per kilowatt DGX H100 example is used as the SSD rack’s final airflow requirement.
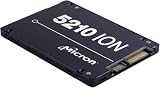
Best Value

- Micron Ion 5210 Enterprise Solid State Drive and HPE ProLiant Server 2.5” Drive Tray, made for production environments and compatibility with most Dell PowerEdge servers!
- Comes With 2.5" (SFF) Dell Compatible Tray
- 7.68TB SATA SSD Capacity
- Compatible with Dell PowerEdge R440, Dell PowerEdge R640, Dell PowerEdge R740, Dell PowerEdge R740XD, Dell PowerEdge R840, Dell PowerEdge R940, and Dell PowerEdge T640 Servers
Correction: Use it only as a labeled reference. Obtain the actual chassis airflow and pressure-drop data, then have facilities calculate the requirement for the site’s altitude, temperatures, containment, and component rise.
Filling the rack to its physical maximum
Symptom: All drive bays are populated even though the rack’s power, cooling, network, or service margin is exhausted.
Correction: Set a lower approved population, distribute systems across additional racks, or upgrade facility capacity. NVIDIA’s DGX H100 guidance notes that density can be customized to available power and cooling and that reducing density can increase the number of racks required.
Ignoring growth and maintenance states
Symptom: The design works only at today’s capacity and steady-state load.
Correction: Include growth, hot spares, rebuilds, firmware updates, failed-feed operation, and planned expansion in the initial rack and power budget.
9. Validate the design with facilities and platform owners
- Freeze the candidate configuration: exact SSD SKU, form factor, chassis, backplane, firmware, drive count, host, network, and power supplies.
- Run the capacity model: show raw, protected, usable, and growth-adjusted values, including data-reduction assumptions.
- Run the electrical model: show drive states, system components, conversion losses, feed allocation, redundancy, and reserve margin.
- Run the thermal model: translate the complete IT load using the site’s approved method and check airflow, temperature rise, containment, altitude, and failure conditions.
- Draw the rack: include rack units, PDUs, switches, cable routing, blanking panels, weight, and service access.
- Review network and operations: confirm bandwidth, optics, management paths, replacement procedures, and maintenance windows.
- Approve a population limit: document the maximum drive and chassis count allowed for the rack, along with the conditions that would require another rack or a facility upgrade.
NVIDIA’s guidance emphasizes that rack density and deployment layout must fit available power and cooling. Treat that as a governance requirement: facilities and the platform team should sign off on the complete rack, rather than allowing procurement to maximize the drive count independently.
10. What to request from vendors before purchase
- Exact active, idle, startup, and worst-case power values for the chosen capacity and form factor.
- Thermal limits, airflow direction, minimum airflow, pressure drop, and allowable inlet temperature.
- Qualified servers, enclosures, backplanes, carriers, firmware versions, and supported population levels.
- Performance and endurance data for the intended read/write mix, not only a sequential headline.
- Drive-count, chassis, rack-unit, and power assumptions behind any density comparison.
- Weight, service-clearance, cable-routing, and replacement requirements for the populated chassis.
Keep vendor claims attributed. Micron’s 20W, 12GB/s statement and its rack-density figures are product-positioning data; Solidigm’s 122.88TB figure is a published maximum capacity; and NVIDIA’s airflow example belongs to its DGX H100 design context. None substitutes for qualification of the exact deployment.
Recommended Free Tools
Decision rule
Select the configuration that meets usable capacity, workload, endurance, and availability requirements while remaining inside the site’s power, thermal, airflow, weight, network, and serviceability envelopes. If the theoretical drive density violates any one of those limits, reduce the population or add racks. The right answer is the highest sustainable system-level density, not the highest number printed on a drive specification sheet.
Quick Recap
Product prices and availability are accurate as of the date/time indicated and are subject to change. Any price and availability information displayed on Amazon at the time of purchase will apply.

