What’s actually slowing this PC down?
Pick the symptom - the matching free tool is one click away.
To monitor a VPS effectively, track CPU use and load against its vCPU count, available memory and paging, filesystem space and disk activity, network traffic, uptime, and the health of the services running on it. Use a dashboard to investigate trends and alerts for sustained conditions that need attention; brief spikes alone do not necessarily mean the server needs more capacity.
Which VPS performance metrics should you monitor?
Start with a small set that can reveal both resource pressure and service failures. A host dashboard helps show what the machine is doing; process, log, and application checks help explain why it is doing it and whether users can reach the service.
As an Amazon Associate I earn from qualifying purchases.
Free tools Windows power users keep installed
One-click scans. No signup required.
- CPU utilization and load average: Track both over time, along with the VPS’s vCPU count.
- Memory and paging: Check available memory, swap or paging activity, and out-of-memory events when your monitoring tool exposes them.
- Storage: Track free space on each filesystem and, where available, inode use. Monitor read/write activity and I/O wait separately from capacity.
- Network: Watch inbound and outbound traffic and network errors where available. If the provider separates public and private traffic, use that distinction to help locate activity.
- Uptime and service health: Host uptime indicates whether the machine is running; a service-specific check is needed to establish whether a website, API, or other service responds as expected.
How do you interpret CPU, memory, and disk readings?
CPU utilization and load average
CPU utilization shows how much processing capacity is in use. Load average includes work using or waiting for CPU, so interpret it in relation to the number of vCPUs rather than applying one threshold to every server. DigitalOcean notes that a load average of two can overwhelm a one-vCPU Droplet but represent half the available CPU capacity on a four-vCPU Droplet. Sustained load above the vCPU count can indicate pressure; a short excursion in the 1- or 5-minute average may reflect brief activity. Compare 1-, 5-, and 15-minute averages to see whether a rise is brief or persistent. DigitalOcean’s Droplet monitoring documentation
A host-wide CPU graph identifies busy CPU, not the process responsible. When it points to a problem, inspect process- or application-level views as well. Grafana’s Linux integration documentation
#1 Best Overall

- Ventilation Fan: Designed to quietly ASUS GT/RT- AC5300 , cool Xboxs, CPU/ GPU, Playtations, Rokus, TVs, receivers, mondems, routers, DVRs, window fans ,network appliances, DIY aquarium cooling and other audio video electronics
- Variable Speed Control: 110V - 220V Fan power supply with speed control function, turn the knob to adjust the speed, 4V - 12V adjustable fan speed,and can turn off the fan . | Input: 100V - 240V 50/60Hz | Output: DC 3-12V 200-2000ma
- DIY Vertical Window Fan: Can both vertical and horizontal, provide efficient cooling and ventilation. Mining rigs rely on the cooling power of fans for optimal operation.Double Metal Protective, the fan is equipped with double metal protective net
- Easy to Install: Draw out air in refrigerators, provide ventilation in greenhouses, prevent amplifier overheating, and vent hot air from living room consoles like PS4. Y cable connects 2 fans, two fans can be 42cm/16.5 in far away from each other
- Dual Ball Bearing: 240mm x 240mm x 25mm / 9.45in(L) x 4.72in(W) x 1in(H) in in total. | Rated Voltage :12V | Rated Current: 0.93A at full speed | Airflow: (82CFM)x4 at 12V | Speed: 2500 RPMx4
Memory, cache, and swap
A high memory percentage does not always mean applications are short of memory. Linux uses spare memory for disk cache and can release that cache as applications need it. In its documented Droplet calculation, DigitalOcean subtracts free and cached memory from total memory to report used memory; it notes that top or htop can appear to show higher use because they count cached memory differently. This is a provider-specific calculation, not a universal rule for every tool.
Check available memory alongside swap or paging activity and out-of-memory events. Grafana’s documented Linux dashboard includes paging and OOM Killer information, which can help distinguish cache from pressure that may affect applications. Grafana’s Linux integration documentation
Rank #2
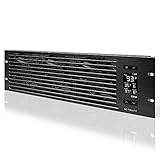
- An intelligent fan system designed for cooling audio video, DJ, server, network, and IT equipment racks.
- Protects rack-mount equipment from overheating, performance issues, and shortened lifespans.
- Programmable thermostat controller with automated speed control, alarm warnings, and backup memory.
- Premium anodized aluminum construction with CNC-machined detailing for a professional appearance.
- Size: 3U Rack Space | Design: Intake | Airflow: 60 to 300 CFM | Noise: 12 to 38 dBA | Bearings: Dual Ball
Filesystem capacity versus disk activity
Free space and disk activity answer different questions. A filesystem nearing capacity is a storage-space concern; heavy reads or writes and rising I/O wait can affect performance even when there is ample free space. Track availability per filesystem, plus read/write activity and wait where your monitoring tool provides them. Grafana documents views for filesystem availability, read/write activity, and average wait times. Grafana’s Linux integration documentation
Check what storage a graph actually covers. DigitalOcean documents its Droplet root-disk metric as excluding attached block-storage volumes, which are monitored separately. Other providers may define their graphs differently, so verify the scope before relying on a single total. DigitalOcean’s Droplet monitoring documentation
Rank #3

- [Adjustable] Adjustable temperature control helps ensure optimal performance for your rackmount such as network, server, music, and AV cabinets
- [Quiet and powerful] Equipped with three powerful 4” (120mm) noise control ball bearing fans capable of pumping 225 CFM of air, preventing overheating of expensive equipment
- [Optimal Airflow] This three fan cooling system will provide excellent cooling with its high-performance fans, which keep the hot air stream away from your setup with its top exhaust cool air system.
- [Compact Design] Device is standardized to mount to any 19" server rack or cabinet while taking only a single unit (1U) of space and has a wide variety of applications.
- [Programmable] Equipped with a programmable thermostat sensor controller for better temperature monitoring that will trigger fans based on your parameter configuration.
Which monitoring tools can you use?
The main choice is between provider-integrated monitoring and a separately managed software stack. The options below reflect documented features, not a side-by-side benchmark of performance, resource overhead, or total cost.
Do these 3 things before closing this tab:
1Fix the driver behind crashes, sound loss and screen glitches2Clear out junk files and repair common Windows errors3Scan for outdated or missing drivers - takes under a minute| Approach | What the documentation establishes | Trade-off |
|---|---|---|
| VPS provider monitoring | DigitalOcean documents free, opt-in Monitoring for Droplets, with an agent, graphs, and configurable alert policies. The agent is not installed by default. These details apply to DigitalOcean Droplets, not all VPS providers. DigitalOcean documentation | Convenient control-panel visibility, but metric definitions, retention, supported platforms, and alert features vary by provider. |
| Prometheus / Node Exporter with Grafana | Grafana’s Linux integration uses node_exporter and provides host metrics and dashboards. Grafana documentation | Offers a configurable, self-managed metrics and dashboard stack, but adds components to install, secure, update, store data for, and maintain. |
| Netdata | Netdata documents VM and container collection for CPU, memory, disk I/O, and network. Netdata documentation | Evaluate its deployment mode, data retention, alerting, and any hosted-service plan details against current product documentation. |
Choose based on how much setup and ongoing maintenance you want, how much history and dashboard customization you need, how alerts are delivered, and whether you are monitoring one VPS or a fleet.
Rank #4

- Adjustable temperature control helps ensure optimal performance for rackmount such as network, server, music, and AV cabinets
- Noise controlled fans makes the cooling system useful for a quiet office or business space
- Compact design mounts to any 19" inch cabinet and takes up only 1 unit of space
- Simple and easy to use LCD display allows user to control temperature
- Air pumped through to the top exhaust system of the fan
How to set up monitoring and useful alerts
- Inventory the server. Note its provider, operating system, vCPU count, storage volumes, and critical services. Check whether provider monitoring supports the VPS and what the agent measures.
- Enable or install the monitoring agent. For DigitalOcean Droplets, the quickstart documents enabling the agent during Droplet creation or installing it later; it is not installed by default. Confirm that the service is active and graphs are receiving data. DigitalOcean’s setup guide
- Build an overview dashboard. Include CPU, load, memory, disk space, disk activity, network, and uptime. Add process, filesystem, log, and application-specific views to investigate likely problems. Grafana’s Linux integration documents host dashboards and a logs dashboard. Grafana’s Linux integration documentation
- Alert on conditions that need action. Set alerts for sustained pressure rather than every short-lived spike. DigitalOcean’s quickstart lists CPU, load, memory, disk, and bandwidth alerts, with durations from five minutes to an hour. Its product guidance suggests 70% as a starting point for CPU, memory, or disk usage; treat that as a DigitalOcean starting suggestion, not a universal threshold. Choose conditions and durations according to your workload and service needs. DigitalOcean’s alert guidance
- Verify notification delivery. Confirm that the responsible operator receives alerts and review the configuration after a real or safely simulated threshold event. A configured alert is useful only if it reaches someone able to act on it.
- Review trends and tune. Use dashboard history to spot changes and adjust thresholds when alerts are noisy or fail to flag sustained pressure. Keep dashboards for investigation and notifications for conditions requiring attention.
How do you move from a warning to a cause?
Host metrics can tell you that CPU is busy, memory is under pressure, disk activity is high, or traffic has changed. They do not necessarily identify the workload or event behind the change. Use process-level metrics and logs to narrow down the cause; Grafana documents process and memory views as well as a logs dashboard, while noting that an aggregate CPU view does not name the responsible process. Then check the affected application directly, because machine health alone does not establish that the service is responding correctly. Grafana’s Linux integration documentation
Quick Recap
Best Value
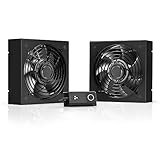
- A quiet fan kit designed for standard 19” racks, to be mounted on the roof or to replace existing fans.
- Features a speed controller utilizing PWM which can control the fan's speed without generating noise.
- Compatible with CLOUDPLATE series rack fans and can be linked to share the same programming.
- Heavy-Duty steel construction with spiral fan guards, mounting hardware, and power adapter.
- Size: Standard 120mm Rack Fans | Fans: 2 | Airflow 200 CFM | Noise: 26 dBA | Bearings: Dual Ball
Product prices and availability are accurate as of the date/time indicated and are subject to change. Any price and availability information displayed on Amazon at the time of purchase will apply.

