Uptime checks tell you whether a probe could reach an endpoint at a particular moment. Meaningful infrastructure monitoring also tells you whether users can complete important tasks, how well the service performs, and which component is responsible when something goes wrong. Build monitoring around user-visible service behavior, then use infrastructure and application telemetry to investigate it.
What infrastructure monitoring should tell you
A service can be reachable and still fail users. A website might return a successful response while a shopping-cart action fails, for example. OpenTelemetry frames reliability around whether a service is doing what users expect, not merely whether it is up (OpenTelemetry’s observability primer).
As an Amazon Associate I earn from qualifying purchases.
Start by identifying critical user journeys and the service boundaries that support them. Define indicators that measure the experience of those journeys: whether an important action succeeds, how long it takes, and how often it fails. An SLI, or service-level indicator, is a measurement of service behavior; a useful one measures that behavior from the user’s perspective.
Keep infrastructure measurements such as CPU utilization, memory, request rate, and error rate. They help explain symptoms and plan capacity, but a resource metric alone does not prove that users are affected. For example, high CPU may signal pressure; pair it with service-level behavior to understand whether that pressure is harming a critical action.
#1 Best Overall

- 【Up to 1100 Mbps VPN Speed 】 Hardware-accelerated WireGuard and OpenVPN-DCO deliver up to 1100 Mbps VPN throughput, over 3× faster than Brume 2 for smooth remote access and file transfers.
- 【Three 2.5G Ports & Multi-WAN】Tri-port 2.5GbE design with flexible WAN LAN configuration supports multi-gigabit wired setups, dual-ISP Multi-WAN and failover to keep home and SOHO networks online.
- 【Stealth VPN Obfuscation】VPN obfuscation disguises VPN traffic as regular HTTPS, helping you evade blocking, bypass restrictive networks and maintain stable, private connections.
- 【DPI protection】Deep Packet Inspection with visual dashboards blocks adult/gambling/malicious sites, while SQM and QoS prioritize gaming, calls, and video when bandwidth is tight
- 【OpenWrt & USB 3.0 Expansion】OpenWrt with 1GB DDR4 and 8GB eMMC lets you install plugins and build VPN, ad-blocking or NAS, while USB 3.0 Type‑C connects high-speed storage or 4G/5G dongles
Which signals to collect—and what each one explains
Metrics, logs, and traces answer different questions. They become more useful when collected with enough shared context to connect them during an investigation. OpenTelemetry documents metrics, logs, and traces as distinct telemetry signals (Signals).
Metrics: how behavior changes over time
Metrics are numeric measurements that can be aggregated across a time window. Use them to see trends and scope: request volume, error rate, latency distributions, CPU, or memory pressure. They can help establish when a symptom began and whether it is widespread, but aggregates usually do not identify the individual operation that caused it.
Rank #2

- APPLIANCE ONLY: Hardware unit sold without a service subscription — security services, firmware updates and support are NOT included and must be purchased separately to activate protection.
- PERFORMANCE: Up to 2.5 Gbps firewall inspection, 1 Gbps threat prevention and 1.2 Gbps IPSec VPN throughput driven by SonicWall's patented Reassembly-Free Deep Packet Inspection (RFDPI) engine.
- CONNECTIVITY: 8x1GbE + 2x1G SFP in a desktop form factor; zero-touch deploy and manage on-box or via cloud Network Security Manager (NSM).
- THREAT PROTECTION: SonicOS 8 delivers intrusion prevention, gateway anti-malware, application control, TLS/SSL decryption, Capture ATP multi-engine sandboxing (RTDMI) and reputation-based content & DNS filtering with an active service subscription.
- BUILT FOR SMALL BUSINESS & BRANCH: Secure SD-WAN, IPSec and SSL VPN plus Zero-Trust Network Access through Cloud Secure Edge keep distributed sites and remote workers protected.
Logs: what happened at a particular moment
Logs preserve discrete, timestamped events and their contextual details. Structured records and resource attributes—such as the service, host, or pod that emitted an event—make application and infrastructure logs easier to search and interpret. A log can explain an error or unusual event that a summary metric only signals.
Quick wins for a faster PC:
Scan for outdated or missing drivers - takes under a minuteDriver Scan →Repair Windows errors before they cause bigger problemsFix Now →Fix the driver behind crashes, sound loss and screen glitchesFind Drivers →Traces: where a request spent time or failed
A trace follows a request as it moves through components. Its spans represent individual operations, with timing and context that help show which service or dependency was slow or unsuccessful. Traces are especially useful when a user action crosses multiple services (OpenTelemetry’s observability primer; trace overview).
Rank #3

- Aruba Central Ready AirWave 8 Appliance
- Aruba Central Ready AirWave 8 Appliance
- Aruba Central Ready AirWave 8 Appliance
Profiles: sampled resource use at code level
Profiles can show which code paths consume resources and can be connected with other telemetry when instrumentation and the backend support it. Treat profiling as a complement rather than a universal baseline: OpenTelemetry’s profiles documentation currently labels the signal Alpha (Profiles).
How to connect a user symptom to its cause
- Detect the user-facing symptom. Notice a critical action failing, slowing down, or behaving incorrectly rather than relying only on an endpoint reachability check.
- Use an SLI or metric view to establish scope. Determine when the issue began and whether it affects one journey, a subset of requests, or a broader part of the service.
- Follow representative requests in traces. Inspect the sequence and timing of spans to locate a slow or failing component.
- Check related logs. Look for events around the same trace or span and on the relevant service, host, or pod.
- Use profiles when the evidence points to code-level resource use. This can help identify expensive code paths where profiling is supported and suitable for the environment.
Correlation depends on more than matching timestamps. OpenTelemetry’s logging specification describes three useful dimensions: execution time, trace context—including trace and span IDs—and resource context, such as the originating host, pod, or service (OpenTelemetry logging specification). Shared trace context can connect a log record to a trace; resource attributes help identify where the event originated. If instrumentation or context propagation is inconsistent, moving between signals can become fragile.
Rank #4
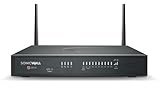
- APPLIANCE ONLY: Hardware unit sold without a service subscription — security services, firmware updates and support are NOT included and must be purchased separately to activate protection.
- PERFORMANCE: Up to 2.5 Gbps firewall inspection, 1 Gbps threat prevention and 1.2 Gbps IPSec VPN throughput driven by SonicWall's patented Reassembly-Free Deep Packet Inspection (RFDPI) engine.
- CONNECTIVITY: 8x1GbE + 2x1G SFP + 802.11ax Wi-Fi in a desktop form factor; integrated 802.11ax (Wi-Fi 6) wireless; zero-touch deploy and manage on-box or via cloud Network Security Manager (NSM).
- THREAT PROTECTION: SonicOS 8 delivers intrusion prevention, gateway anti-malware, application control, TLS/SSL decryption, Capture ATP multi-engine sandboxing (RTDMI) and reputation-based content & DNS filtering with an active service subscription.
- BUILT FOR SMALL BUSINESS & BRANCH: Secure SD-WAN, IPSec and SSL VPN plus Zero-Trust Network Access through Cloud Secure Edge keep distributed sites and remote workers protected.
How to make alerts useful
Alert on user-visible impact or on a condition likely to cause it, not on every fluctuation in a metric. A useful alert has a clear owner and points toward an action. For example, a sustained rise in failures for a critical action is more directly meaningful than a CPU change considered without service context. Thresholds depend on the service and its objectives; there is no universal alert value established here.
How to choose a telemetry and collection approach
OpenTelemetry is a vendor-neutral instrumentation and telemetry framework. Its documentation describes exporting telemetry to open-source, commercial, or self-managed backends, with examples including Prometheus and Jaeger (OpenTelemetry documentation). These examples are destinations, not a ranking. Separating instrumentation from backend choice can give a team flexibility, but it does not remove the need to evaluate how a particular backend handles the team’s workloads.
Compare options against the practical needs of your environment:
- Signal coverage and correlation: Confirm that the workflows you need for metrics, logs, traces, and any profiling can be supported, and that engineers can follow shared context between them.
- Deployment and data control: Check whether the product fits your cloud, on-premises, hybrid, or multi-cloud requirements, and establish what telemetry leaves your environment. OpenTelemetry supports varied deployment contexts; product-level details need to be verified with each provider.
- Collection operations: Evaluate how the team will collect, enrich, process, route, and query telemetry, including the operational overhead of agents and pipelines. OpenTelemetry’s Ops guidance treats Collector setup as a core operator task (Getting started for Ops).
- Retention, query, and cost: Compare these against expected data volume and incident needs. They vary by backend and configuration; do not assume a universal retention limit or cost.
- Infrastructure fit: Validate the collection pattern for the environments you actually run, rather than assuming a Kubernetes design will also suit virtual machines or bare metal.
Adapt collection to the infrastructure you run
Collection has to fit the estate. For Kubernetes operations, OpenTelemetry’s Ops path points to Collector setup and Operator automation as areas to learn. Environments without Kubernetes may include virtual machines, bare-metal servers, and directly managed containers. OpenTelemetry’s non-Kubernetes blueprint addresses agent lifecycle management, bootstrap and configuration patterns, telemetry enrichment and routing, and regional or site-local gateways (Getting started for Ops; Infrastructure and Processes in Non-K8s Environments). Choose collection and routing patterns based on the systems you operate and how you need to manage them.
Quick Recap
Product prices and availability are accurate as of the date/time indicated and are subject to change. Any price and availability information displayed on Amazon at the time of purchase will apply.

