What’s actually slowing this PC down?
Pick the symptom - the matching free tool is one click away.
Start by adding meaningful Docker health checks to the services you rely on, then inspect their status with Docker. A container can be running while its application is unable to serve requests, and a “healthy” label only means the configured check passed. Add Prometheus and cAdvisor if you need historical container resource metrics; use separate host monitoring for host-level CPU, memory, disk, or network data.
What Docker container health tells you
Docker’s HEALTHCHECK instruction tells the engine how to test whether a container is working. Docker runs the configured command inside the container and records the result; a zero exit code indicates success, while a nonzero exit code indicates failure. See the Dockerfile reference.
As an Amazon Associate I earn from qualifying purchases.
Health status is distinct from whether the container process is running. Docker reports starting before a check has completed, healthy after a successful check, and unhealthy after the configured number of consecutive failures. Recent probe output is retained in the health status (up to 4096 bytes), and Docker emits a health_status event when the state changes.
A healthcheck measures only the condition its command tests. A successful check does not prove that every user-facing route, dependency, or network path is working. For that, pair in-container checks with external probes appropriate to the service.
#1 Best Overall

- 【AMD Ryzen 3 5300U CPU: Outperforms N150 & 3500U】 BOSGAME E5 mini PC is powered by the TSMC 7nm FinFET architecture AMD Ryzen 3 5300U processor (4 Cores, 8 Threads, up to 3.8GHz boost, 6MB total cache). Compared to low-end Intel N150 or 3500U chips which only have 4 single threads and throttle under load, the 5300U delivers over 30% faster multi-core speed. Run 30+ browser tabs, large Excel sheets, and Zoom meetings simultaneously without system lag.
- 【8GB DDR4 RAM & 256GB NVMe SSD Storage】 Installed with high-speed 8GB DDR4 dual-channel memory and a fast 256GB M.2 2280 SSD, eliminating slow boot times and application loading delays. To accommodate growing data requirements, the upgradeable hardware design features dual SODIMM slots that allow you to expand memory up to 64GB RAM, ensuring smooth operation during heavy multitasking.
- 【High-Capacity Dual M.2 SSD Storage Expansion】 Never worry about running out of space for your business files. In addition to the pre-installed 256GB system drive, the motherboard houses an extra empty internal M.2 2280 NVMe PCIe 3.0 slot. This allows you to easily add a second solid-state drive for up to an additional 2TB of storage capacity (upgrades not included) without needing to remove or reinstall the original operating system.
- 【Radeon 6-Core Graphics & Triple 4K Displays】 Integrated with official AMD Radeon Graphics (6 Graphics Cores, 1500 MHz frequency) for casual gaming, photo editing, and crisp 4K media decoding. Featuring 1x HDMI 2.0 port, 1x DisplayPort, and 1x Full-Function Type-C port, the E5 outputs true 4K@60Hz resolution to three monitors at once. This multi-screen setup eliminates constant window-switching for traders, programmers, and office workers.
- 【Dual 2.5GbE LAN Ports for Advanced Networking】 Experience fast wired network transmission speeds up to 2500Mbps without lagging or buffering. The integration of dual 2.5 Gigabit Ethernet ports (powered by Realtek RTL8125 controller) makes this compact computer an exceptional hardware choice for tech enthusiasts. Easily configure it into software routers, hardware firewalls (pfSense, OpnSense), home NAS servers, or local homelabs.
Add a check that matches the service
The check must use a command and endpoint available in the image. Do not assume tools such as curl are installed. For example, Redis’s own CLI can test readiness with redis-cli ping; Redis responds with PONG when ready. Docker’s Redis quickstart demonstrates this pattern and uses Compose to wait for Redis health.
In a Compose file, a healthcheck can override the one configured by the image. Use CMD for a direct argument array or CMD-SHELL to run the command through the container’s default shell. The following database example needs to be adapted to the image’s actual user and database settings:
Rank #2
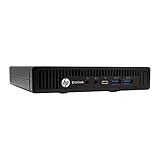
- HP EliteDesk 800 G2 Mini (DM) Desktop PC
- Intel Core i5-6500T Quad Core up to 3.1Ghz Turbo
- 8GB DDR4 Memory + 240GB Solid State Drive
- Windows 10 Professional 64-Bit | Dual Monitor Support VGA + DisplayPort
services:
  app:
    image: example/app
    depends_on:
      database:
        condition: service_healthy

  database:
    image: postgres:18
    healthcheck:
      test: ["CMD-SHELL", "pg_isready -U $${POSTGRES_USER} -d $${POSTGRES_DB}"]
      interval: 10s
      timeout: 10s
      retries: 5
      start_period: 30s
Compose’s healthcheck reference documents the configuration. The doubled dollar signs defer variable expansion to the container rather than Compose.
Recommended Free Tools
Set timings for startup and recovery
Docker’s documented defaults are a 30-second interval, a 30-second timeout, a zero-second start period, and three retries. The default start interval is five seconds; the start_interval option requires Docker Engine 25.0 or later. These are defaults, not a good universal configuration: set timings according to the service’s actual startup and response behavior.
Rank #3
- This Certified Refurbished product is tested and certified to look and work like new. The refurbishing process includes functionality testing, basic cleaning, inspection, and repackaging. The product ships with all relevant accessories, a minimum 90-day warranty, and may arrive in a generic box. Only select sellers who maintain a high performance bar may offer Certified Refurbished products on Amazon.com
- Intel Quad-core i5-6500T up to 3.1G,16G DDR4 memory(2 slots,supports up to 32GB),240G SSD
- Includes USB Keyboard(English Keyboard & Mouse Included)
- I/O ports:Front:2 USB 3.0 ,microphone,headphone ,USB Type-C port Rear:4USB 3.0 ,VGA DP port,RJ-45
- Operating System:Win10Pro64bit
intervalcontrols how often Docker runs the check.timeoutlimits how long a probe may take; Docker kills a probe that exceeds it.start_periodgives a service time to initialize. Failures during this period do not count toward retries until a probe succeeds during the period; after that, consecutive failures count normally.retriessets the number of consecutive failures needed for Docker to mark the container unhealthy.
These behaviors and defaults are documented in the Dockerfile reference.
Use Compose readiness ordering when a dependency matters
Short-form depends_on orders service creation but does not wait for the dependency to become healthy. If an app must wait for its database or cache, configure a healthcheck on that service and use long-form depends_on with condition: service_healthy. Compose then waits for a successful check before creating the dependent service. See the Compose depends_on reference.
Rank #4

- POWERFUL 6-CORE BUSINESS PERFORMANCE: Intel Core i5-8500T 6-core processor (2.1GHz base, up to 3.5GHz turbo, 9MB cache) delivers reliable performance for business applications, multitasking, office productivity, and professional workflows with energy-efficient operation.
- DUAL DISPLAY WITH LEGACY SUPPORT: 2 DisplayPort 1.2 outputs plus VGA port drive dual monitors or connect legacy displays - perfect for offices transitioning equipment while maintaining modern productivity setups.
- FAST 32GB RAM & 1TB SSD: DDR4 memory and M.2 PCIe NVMe SSD provide responsive multitasking and quick boot times for business applications and file access.
- COMPLETE CONNECTIVITY: USB-C, 6 USB ports (4x USB 3.1), WiFi 802.11ac, Bluetooth, Gigabit Ethernet ensure comprehensive device and network connections for modern business environments.
- ULTRA-COMPACT BUSINESS DESIGN: Space-saving 6.97" x 6.89" x 1.34" mini form factor weighs just 2.75 lbs with Windows 11 Pro, perfect for offices, retail, healthcare, and commercial applications.
A healthcheck does not, by itself, restart a container marked unhealthy. Treat health as a signal for inspection, alerting, or a separately designed recovery action. Compose’s dependency restart setting applies to explicit Compose restarts or updates of the dependency, not automated runtime restarts after a container dies.
Free tools Windows power users keep installed
One-click scans. No signup required.
Choose monitoring layers for the question you need answered
| Need | Signal or tool | What it tells you | Limitation |
|---|---|---|---|
| Is the tested service condition passing? | Docker healthcheck, docker inspect, health events |
Whether the configured in-container probe succeeds | Tests only that condition; does not provide resource history. |
| How are containers using CPU, memory, and network over time? | cAdvisor scraped by Prometheus | Container resource and performance metrics | Requires a metrics stack and runtime or host access. |
| What is the Docker daemon doing? | Docker daemon Prometheus endpoint | Engine-level metrics | Does not monitor application metrics; metric names and availability are actively developing. |
| How is the Linux host doing? | Node Exporter or another host monitoring stack | Host-level system metrics | Does not replace application health checks. |
| Can a client reach the service from outside its container? | External HTTP or TCP probe | Network reachability and an externally visible response | A reachable port alone does not establish application correctness. |
Prometheus’s cAdvisor guide shows a local Compose example in which Prometheus scrapes cAdvisor, including container CPU, memory, and network expressions. Its five-second scrape interval is an example, not a general recommendation. Keep Prometheus data on persistent storage if it matters: the Prometheus container installation documentation notes that data stored only inside a container can be lost when that container is replaced.
Best Value
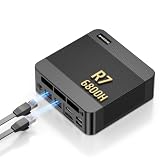
- 【POWERFUL AMD RYZEN 7 6800H PROCESSOR】: The BOSGAME P6 Neo mini Gaming PC is powered by the AMD Ryzen 7 6800H processor, featuring 8 cores, 16 threads, a 3.3GHz base clock, and up to 4.7GHz boost frequency. With 16MB of L3 cache, it delivers responsive performance for office work, content creation, entertainment, multitasking, and everyday computing.
- 【24GB LPDDR5X RAM & 1TB PCIe 4.0 SSD】: Equipped with 24GB LPDDR5X 4800MT/s onboard memory, the P6 Neo Mini pc gaming handles multiple programs and browser tabs smoothly without frequent slowdowns. The included 1TB M.2 2280 NVMe PCIe 4.0 x4 SSD provides fast system startup and file access. Two M.2 2280 SSD slots allow you to add another NVMe SSD when more storage is needed.
- 【RADEON 680M GRAPHICS & TRIPLE 4K DISPLAY】: Integrated AMD Radeon 680M graphics with a frequency of up to 2200MHz, P6 Neo Ryzen 7 6800H Mini PC delivers smooth visuals for streaming, creative applications, and popular games. Connect up to three 4K monitors simultaneously through HDMI 2.0, DisplayPort, and full-function USB-C, each supporting up to 4K at 60Hz, for a more efficient multitasking workspace.
- 【DUAL GIGABIT LAN, WIFI 6E & VERSATILE PORTS】: The AX210 wireless card of the P6 neo mini pc ryzen supports WiFi 6E and Bluetooth 5.3 for fast and stable wireless connectivity, while dual Gigabit Ethernet ports provide flexible wired networking. Connectivity includes three USB 3.2 Gen 2 Type-A ports with transfer speeds up to 10Gbps, one USB 2.0 port, one full-function USB-C port supporting data transfer, PD 3.0, and display output, plus a 3.5mm combo audio jack.
- 【COOL, QUIET & READY TO USE】: The dual-fan cooling system of the P6 neo mini computer helps efficiently remove heat and maintain stable performance while keeping operating noise under control. Windows 11 Pro comes pre-installed for convenient out-of-the-box use, with Ubuntu also supported. An included VESA mounting bracket helps save valuable desk space. BOSGAME mini PCs are FCC, RoHS, and CE certified and include a 1-year warranty for the complete unit and a 3-year warranty for parts.
Docker daemon metrics are a separate view from cAdvisor. Docker’s daemon metrics documentation shows configuring metrics-addr in daemon.json; 127.0.0.1:9323 is a loopback example, while binding to 0.0.0.0 exposes the endpoint more broadly. Keep the endpoint private. Docker cautions that metric names and availability are actively developing, and that daemon metrics do not monitor applications.
For host metrics, Node Exporter provides a host-level signal rather than an application readiness check. Grafana Alloy also offers a cAdvisor exporter; its cAdvisor exporter documentation says it supports Linux and Docker, containerd, CRI-O, and systemd runtimes. Running a collector may require access to the runtime socket and related directories. Grafana warns that Docker group membership grants privileges equivalent to root, so grant it only when that access fits your host’s security boundaries.
Inspect a failed healthcheck
- Check the container’s health status and recent probe output with
docker inspect. Docker stores recent check output in the health state. - Run the configured probe command inside the container. Confirm the executable exists there and that the endpoint, credentials, and target are correct.
- Verify that the probe tests a meaningful service condition. A running process or open port may not mean the application can complete important requests.
- Compare startup and response times with
start_period,timeout,interval, andretries. - If a Compose dependent starts too early, confirm that the dependency has a healthcheck and the dependent uses long-form
depends_onwithcondition: service_healthy. - If Prometheus has missing data, check the scrape target and confirm whether you intended to scrape cAdvisor container metrics or Docker daemon metrics. Keep metrics endpoints inaccessible to untrusted networks.
- If using cAdvisor or Alloy, verify Linux/runtime compatibility and review the permissions granted to the collector, especially Docker socket or group access.
Build a proportionate homelab setup
For a small setup, begin with checks on critical services and use Docker’s health state to spot failures. Add external probes when you need to validate reachability beyond the container. Add Prometheus and cAdvisor only when you have a defined need for retained resource history, thresholds, or dashboards; add host monitoring separately when you need host context.
Before exposing a dashboard or endpoint, decide which systems need access and restrict both metrics endpoints and Docker runtime access to trusted hosts. A monitor that can control or inspect the Docker runtime crosses a meaningful security boundary; do not expose the Docker API or collector access simply to make a dashboard convenient.
Quick Recap
Product prices and availability are accurate as of the date/time indicated and are subject to change. Any price and availability information displayed on Amazon at the time of purchase will apply.

