Crashes, No Sound, or Screen Glitches?
Random freezes, missing sound and display glitches usually trace back to one bad driver. Find and replace yours safely.Free scan · under a minutePC Slower Than It Used to Be?
A free scan shows the junk files, broken settings and background clutter dragging Windows down - then fixes them in one click.Free scan · Windows 10 & 11Build a CloudWatch dashboard around the question an operator needs to answer: is the problem at the input, inside MediaLive’s pipeline, or at an output destination? Use metrics in the AWS/MediaLive namespace with the channel, pipeline, active-input failover label where applicable, and output-group dimensions needed to isolate the affected path. Add alarms based on your channel’s normal behavior and response requirements; AWS does not prescribe universal thresholds.
Plan the dashboard around the failure you need to find
MediaLive sends metric datapoints to CloudWatch every second. CloudWatch aggregates datapoints according to the statistic and period you select, so a dashboard’s resolution is not the same as the metric’s reporting cadence. AWS documents a minimum 30-second refresh rate in the CloudWatch console for these metrics.
As an Amazon Associate I earn from qualifying purchases.
Separate panels by operational question rather than putting every available metric on one graph:
Free tools Windows power users keep installed
One-click scans. No signup required.
- Is input arriving consistently? Track input frame rate and, for applicable transports, input error duration.
- Is MediaLive producing output? Track active outputs and frames replaced with fill.
- Is a destination rejecting delivery? For HTTP output destinations, track 4xx and 5xx errors.
- Which path is affected? Use channel, pipeline, active-input, and output-group dimensions as appropriate.
AWS describes monitoring MediaLive with CloudWatch metrics in its MediaLive metrics documentation. The dashboard groupings below are practical recommendations based on the documented metric definitions, not a tested dashboard template.
#1 Best Overall
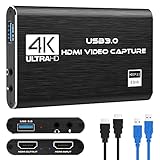
- 【1080P HD High Quality】Capture resolution up to 1080p for video source and it is ideal for all HDMI devices such as PS4, PS3, Xbox One, Xbox 360, Wii U, DVDs, DSLR, Camera, Security Camera and set top box. Note: Video input supports 4K30/60Hz and 1080p120/144Hz. Does not support 4K120Hz/144Hz. Output supports up to 2K30Hz.
- 【Plug and Play】No driver or external power supply required, true PnP. Once plugged in, the device is identified automatically as a webcam. Detect input and adjust output automatically. Won't occupy CPU, optional audio capture. No freeze with correct setting.
- 【Compatible with Multiple Systems】suitable for Windows and Mac OS. High speed USB 3.0 technology and superior low latency technology makes it easier for you to transmit live streaming to Twitch, Youtube, Facebook, Twitter, OBS, Potplayer and VLC.
- 【HDMI LOOP-OUT】Based on the high-speed USB 3.0 technology, it can capture one single channel HD HDMI video signal. There is no delay when you are playing game live.
- 【Support Mic-in for Commentary】Rybozen capture card has microphone input and you can use it to add external commentary when playing a game. Please note: it only accepts 3.5mm TRS standard microphone headset.
Choose dimensions that match the channel configuration
CloudWatch metric widgets identify a metric by namespace, metric name, and dimension pairs. MediaLive dimensions include ChannelID, Pipeline, ActiveInputFailoverLabel, OutputGroupName, and AudioDescriptionName. Put the channel and pipeline identifiers in panel titles or nearby dashboard text so operators can tell which path each graph represents.
Channel and pipeline
Use ChannelID to identify the channel and Pipeline to distinguish its processing path. Standard channels have two pipelines; single-pipeline channels use pipeline 0. When investigating a path-specific issue, ensure the widget uses the relevant pipeline dimension rather than combining paths unintentionally.
Active input failover
Include ActiveInputFailoverLabel when automatic input failover is configured and you want metrics for only the active input. Without that dimension, some metrics may reflect both inputs. Do not add it blindly to a channel without automatic input failover: selecting an inapplicable dimension can produce no datapoints.
Quick wins for a faster PC:
Fix the driver behind crashes, sound loss and screen glitchesFind Drivers →Clear out junk files and repair common Windows errorsFree Scan →Output groups
Use OutputGroupName when you need to distinguish output-group behavior, such as a healthy output path from one whose destination is returning errors. Add other dimensions only when they match the metric and the configuration being monitored.
Rank #2
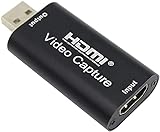
- 【1080P 30FPS Full HD Recording】The HDMI capture card connects to your video source and computer, and captures high-definition video up to 1080p 60fps
- 【HDMI Video Capture】Based on high-speed USB 2.0 technology, you can capture a high-definition HDMI video and HDMI audio signal of a signal channel, sending audio and video signals to computers /pc. The gaming capture card is suitable for devices with HDMI output, such as devices for PS4, for Xbox one, for Wii U and for Switch
- 【Screen Sharing for Meetings】The video capture card is a fast, familiar and economical way to share content in conference rooms and online meetings. Connect to presentations without software, just connect to a laptop or tablet via HDMI to start sharing
- 【Plug and Play】This USB capture card does not need to install a driver, so you can use the built-in functions of the current software to get a seamless experience. Because the video capture device is compatible with most third-party software, it can be plug-and-play for Windows, for Ma OS X, and for Linux. The USB2.0 high-speed transmission port makes it easier for you to have real-time streaming for Twitch, for Youtube, for OBS, for Potplayer and for VLC
- 【Compact & Portable】The capture card is small size & easy to carry, convenient for outdoor and indoor live broadcasting. We provide 30 days no question asked money back and lifetime technical support, if you have any problem, please feel free to contact us
Build panels for input, output, and pipeline health
Input condition
InputVideoFrameRate— use the recommended Maximum statistic to see whether frames arrived during the period. A value of zero means input was received at some point since channel start, but no frames arrived during the current period.ChannelInputErrorSeconds— consider this for applicable RTP Push, SRT, or MediaConnect inputs.NetworkIn— useful as traffic-rate context, but it includes more than media payload and is not a pure ingest-bitrate measure.
Output condition
ActiveOutputs— use the recommended Minimum statistic to reveal intervals when no outputs were successfully written. A value of zero means none were successfully written; check whether pause-on-input-loss behavior makes that state intentional.FillMsec— measures input frames dropped during the period and replaced by fill frames. A non-zero value can signal unhealthy input. Automatic input failover can keep this value at zero even when one input has a problem.NetworkOut— use the Average statistic for traffic-rate context. LikeNetworkIn, it includes other service traffic, not only media payload.Output4xxErrorsandOutput5xxErrors— use the Sum statistic to observe HTTP errors returned by output destinations.
Pipeline and workflow context
Add PipelinesLocked or active-alert metrics if they apply to the channel configuration and correspond to a response your team can take. MediaLive publishes other metrics as well; consult the metric reference before adding a signal whose meaning or scope is unclear.
Set periods for incident response and historical trends
The period controls how datapoints are aggregated and affects how far back CloudWatch can show a metric. AWS documents availability for up to 15 months, with maximum history depending on the query period:
| Query period | Maximum historical range | Useful for |
|---|---|---|
| 1 second | 3 hours | Recent, high-detail incident investigation |
| 5–60 seconds | 360 hours (15 days) | Recent operations and short-term review |
| 5 minutes | 1,512 hours (63 days) | Multi-week patterns |
| 1 hour or longer | 455 days (15 months) | Long-range trends |
Use short periods where responders need to see brief interruptions; use coarser periods for longer-term patterns. A period that is too coarse can hide short events, while a very short period limits the historical range available in that view. For details on metric periods, statistics, and dimensions, see AWS’s MediaLive CloudWatch guidance.
Create the CloudWatch dashboard
- In the AWS console, open CloudWatch in the same Region as the MediaLive channel and choose Dashboards.
- Create or open a dashboard, then add metric widgets for the
AWS/MediaLivenamespace. AWS documents metric widgets and dashboard JSON in the CloudWatch dashboard documentation. - For each widget, select a metric and the dimension values that identify the channel path, such as channel ID and pipeline; include failover or output-group dimensions only when applicable.
- Choose the statistic and period that suit the signal. Start with the metric-specific recommendations above, then verify that the graph’s aggregation makes operational sense.
- Arrange widgets under clear labels such as Input, Output, and Pipeline. Add text or descriptive titles showing the channel, pipeline, output group, and time context.
- Review the dashboard during normal operation and an incident or controlled operational check. Confirm that expected metrics appear and that the selected dimensions isolate the intended path.
CloudWatch dashboard metric entries use a namespace, metric name, and dimension pairs. Dashboard widgets can also use metric math to display a derived time series. Use math only when the signals have compatible dimensions, periods, and missing-data behavior; an apparently simple combination can mislead if one series is absent or represents a different path. See dashboard widgets and CloudWatch metric math.
Rank #3
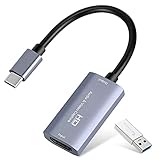
- 【1080P 60FPS Video Capture Card】 This HDMI game capture card is based on USB3.0 high speed transmission port, input resolution up to 4K@30HZ, output resolution up to 2K@30Hz or 1920×1080@60Hz. Type c and USB interface can meet most of the devices in daily life. Easily meet the online capture, real-time recording, online meetings, live gaming and other functions, so you have a better visual enjoyment. Note: For capture use only; requires capture software to function and is not intended for direct screen casting to a monitor or TV
- 【Ultra Low Latency Screen Sharing】 HDMI capture card is made of good quality aluminum alloy with strong heat dissipation, allowing you to enjoy ultra low latency while live gaming or video recording or live streaming, avoiding blue screens and lag. This HDMI to USBC capture card supports easy recording of good quality audio or HD video and transferring it to your computer or streaming platform, allowing you to record 60 fps HD video directly on your hard drive and real-time preview
- 【Plug and Play, Easy to Carry】 This HDMI 1080P video capture card does not require any additional drivers or external power supply, just plug and play for fast capture. The capture card is small and lightweight, so you can put it in your bag for emergencies, making it very portable for outdoor live streaming. It's also a great way to share content in game recording, video conference, video recorder and online teaching
- 【Wide Compatibility USB Capture Card】 Easily streams to Facebook, Youtube or Twitch. With the connection, this HDMI to USB C/3.0 video capture devices can be working on several Operating Systems and various software: Windows 7/ 8/ 10, Mac OS or above, Linux, Android, Laptop, Xbox One, PS3/PS4/PS5, Camera, DVDs, Set Top Box, Webcame, DSLR, Switch/Switch 2, TV BOX, HDTV, Potplayer/VLC, ZOOM, OBS Studio etc.
- 【Package Content & Note】 1x HD Audio Capture Card , 1x USB 3.0 to USB C Adapter (A-side 3.0, B-side 2.0), 1x user manual. Please note that you need to restart the OBS Studio software after the audio setup is complete, otherwise it will result in no sound output. When using an adapter, if the device is recognized as USB 2.0, try using the other side with the USB-C port. Simply flip the capture card and reconnect it to be recognized as USB 3.0
Interpret zeroes and missing datapoints differently
A zero is a recorded value; missing data means CloudWatch has no datapoint for the selected metric and dimensions during the relevant interval. Neither should be interpreted without checking channel state, input availability, transport, and dimension selection.
InputVideoFrameRateis zero: MediaLive received input at some point since channel start, but no frames arrived in the current period.- No datapoints appear: the channel may not have received input since it started, the selected dimension may not apply, or the metric may not be available for the current state or configuration. Check dimensions before treating this as an outage.
ActiveOutputsis zero: no outputs are being successfully written. Check destination and channel behavior, including whether pause-on-input-loss is configured to pause outputs.FillMsecstays at zero during an input issue: automatic input failover may be maintaining the output by switching inputs.
The MediaLive metric definitions describe metric-specific interpretation and availability. Check those definitions when a graph looks inconsistent with the channel’s observed state.
Independent reader supportYour contribution helps us test, update, and keep practical guides available for everyone.Alarm on actionable deviations
CloudWatch alarms can monitor metric thresholds and send notifications or take configured actions. Choose a statistic, period, threshold, comparison operator, and number of datapoints based on what the channel should produce, how long a deviation can last, and what response your team can make. AWS documents alarm behavior in the CloudWatch alarm guide; it does not define one threshold set that fits every MediaLive channel.
What’s actually slowing this PC down?
Pick the symptom - the matching free tool is one click away.
Set thresholds from an operating baseline
- For frame rate, compare against the expected input frame rate and decide how long a deviation must persist before paging.
- For active outputs, define whether zero is always actionable or can occur during a planned pause or input-loss response.
- For fill frames and HTTP output errors, consider normal transient behavior, destination expectations, and the time needed to recover.
- For missing-data alarms, explicitly decide how initialization, stopped channels, paused outputs, and waiting-for-input states should behave; otherwise expected transitions can create noisy alerts.
Use events as a complementary signal
MediaLive state-change and alert events are delivered through CloudWatch Events, now commonly surfaced through EventBridge. AWS describes event delivery as best-effort, so treat these events as a useful companion to metric-threshold alarms rather than the sole alerting mechanism. See the MediaLive event documentation.
Rank #4

- Turn Your Camera into a Pro Webcam: Connect your DSLR or mirrorless camera to any computer and go live in stunning quality
- Stunning quality: Stream and record in 1080p60 or even 4K60 for razor-sharp detail (Requires a compatible camera and the latest Cam Link 4K model)
- Connect More Than Just Cameras: Use a camcorder, action cam, or even your iPhone to level up your content
- No Lag, No Delays: Ultra-low latency keeps your video and audio perfectly in sync, just like it should be
- Your iPad, Now a Pro Field Monitor: Preview your shots in real time on an iPad with USB-C
Consider workflow monitor alarm templates
MediaLive workflow monitor can associate alarm template groups with signal maps. A template uses an existing CloudWatch metric and defines its statistic, comparison operator, threshold, period, and datapoints. AWS offers recommended templates, but confirm they fit the resources and response objectives in the workflow. See workflow monitor alarm templates.
Choose the right monitoring view and understand charges
The MediaLive console’s Health tab shows some supported metrics for time ranges from the last hour through the last week. AWS says CloudWatch exposes all MediaLive metrics and historical data, and metrics can also be retrieved through CLI, REST API, or SDK. The CloudWatch console minimum refresh rate is documented as 30 seconds; do not confuse that display refresh with MediaLive’s one-second metric datapoint cadence.
A namespace card appears in a selected Region only when a channel has been started within the last 15 months. The Health tab has no charge to view its supported metrics. For CloudWatch console viewing or API retrieval, check current CloudWatch pricing for your account’s usage; the Health tab’s no-charge status does not mean all CloudWatch operations are free.
The Tool Desk
Outbyte PC Repair FREERepair Windows errors before they cause bigger problemsFix Now →Outbyte Driver Updater FREEScan for outdated or missing drivers - takes under a minuteDriver Scan →Troubleshoot common dashboard problems
- A widget has no data: verify the Region, channel state, metric applicability, and dimension values. Remove
ActiveInputFailoverLabelunless automatic input failover is configured and that isolation is intended. - A graph shows zero but the channel is not obviously down: inspect the metric’s specific meaning and configuration. Zero frame rate means no frames in the current period; zero active outputs can be intentional with pause-on-input-loss behavior.
- Input traffic looks healthy but frames are missing:
NetworkInincludes non-media traffic, so it does not prove valid video frames are arriving. CheckInputVideoFrameRateand applicable input error metrics. - There are fill frames or output errors: use the input and output panels together. Fill frames can indicate dropped input frames; HTTP 4xx/5xx metrics identify destination responses, helping separate source trouble from delivery trouble.
- An alarm fires during a planned transition: review missing-data treatment, channel lifecycle, pause behavior, evaluation period, and datapoints-to-alarm. Tune the alarm to the states that should actually require action.
- A recent spike is hard to find in history: shorten the period for detail, keeping in mind that finer periods have shorter maximum historical ranges.
- Panels disagree: check whether they use the same channel, pipeline, output group, period, and compatible statistics. Do not use metric math to combine signals with mismatched scope or missing-data behavior.
Or let it run in the cloud
This guide is for AWS MediaLive operations. If your separate goal is to keep a prerecorded YouTube channel live 24/7, StreamNeo is a different service: upload a video or playlist, add your YouTube stream key, and go live. It loops uploaded videos from the cloud, so nothing has to stay on at home. It streams YouTube only and does not go live from a camera.
StreamNeo streams your upload as made, up to 4K 60fps, at one flat price per slot; it automatically recovers if YouTube drops the stream. The first day is free with no card. Monthly: $9.99 per month. See StreamNeo, or start the free first day.
Quick Recap
Product prices and availability are accurate as of the date/time indicated and are subject to change. Any price and availability information displayed on Amazon at the time of purchase will apply.

