To measure tree canopy cover and tree counts reliably, first define the woodland boundary, survey date and what qualifies as a tree. Then either count every eligible tree or estimate the count from representative sample plots. Measure canopy with a repeatable field layout or a named imagery product, and report the method: different methods can produce different results.
1. Define the area and what you are measuring
Use the same mapped or described woodland boundary for the canopy estimate and tree count. Record the survey date and, where relevant, the season. Canopy cover means the area covered by branches and leaves when viewed from above; it is an area measure, not simply an observer’s impression of how closed the woodland feels. UK government guidance provides this definition.
As an Amazon Associate I earn from qualifying purchases.
Before counting, write down the inclusion rule. Specify any minimum diameter or height, whether dead trees count, how to treat regeneration, and whether multiple stems from one individual count as one tree or several stems. Apply the same rule in every plot and in any later repeat survey. Standardized inventory guidance, such as the Great Britain National Forest Inventory materials, helps establish consistent definitions and procedures.
2. Choose a tree-count method
| Method | Use it when | What to report |
|---|---|---|
| Complete tally | The site is compact and every eligible tree can be located and counted. | Boundary, inclusion rule, date and total count. |
| Sample plots | The woodland is larger, varied, or too costly to tally completely. | Sampling design, plot area and number, counts, and the resulting estimate and uncertainty where calculated. |
FAO forest-inventory guidance explains that a complete inventory can suit relatively small forest areas, while sampling is generally more practical over larger areas. Sample units may be plots, strips, stands or points. Their size and number depend on the objectives, expected tree frequency, desired precision, effort and cost. Use a random or systematic layout suited to the woodland and access conditions; a convenient plot near a track may not represent the whole site. See FAO guidance on forest inventory.
#1 Best Overall

- Use to determine forest overstory density or as one indicator in wetland delineation work
- The densiometer is shaped like a convex lens or a hemisphere, with a spherical surface that reflects the image of the forest canopy.
- A complex and intricate design that is both unique and beautiful.
Calculate density from sample plots
- For each plot, record its measured area and the number of trees meeting your inclusion rule.
- Convert plot area to hectares. Calculate plot density as eligible tree count divided by plot area in hectares.
- Estimate woodland-wide density using the sampling design, rather than assuming one plot represents the entire woodland.
- If a total-tree estimate is needed, multiply the estimated density by the mapped woodland area and label the result as an estimate, not a complete count.
For example, if a plot measures 0.1 hectare and contains 18 eligible trees, its observed density is 180 trees per hectare. That is a plot result, not by itself a reliable woodland-wide estimate; the broader estimate depends on how plots were selected and how variable the site is.
3. Measure canopy cover in the field
Use a documented layout that can be repeated. One practical approach is to lay transects across the woodland or sample plot and record whether canopy is present at regularly spaced points. A field manual from Bangladesh describes observations along north–south and east–west transects using a GRS densitometer, with canopy classified as covered or uncovered at observation steps. This is an example protocol, not a universal standard. See the field manual.
Rank #2

- The densiometer is shaped like a convex lens or a hemisphere, with a spherical surface that reflects the image of the forest canopy.
- A Spherical Crown Densiometer is a tool used for measuring the density and distribution of tree crowns in forests and woodlands.
- Use ; To Determine Forest overstory density or as one indicator in wetland delineation work
- The device is typically held above the head and oriented towards the forest canopy to take measurements.
- A complex and intricate design that is both unique and beautiful.
- Set the transect direction, start and end points, and spacing between observation points.
- At each valid point, apply the same canopy definition and record covered or uncovered. If using an instrument, name it and follow a consistent observation procedure.
- Divide covered observations by all valid observations, then multiply by 100.
For instance, 62 covered points out of 100 valid observations gives a sampled canopy-cover estimate of 62%. Report the transect or point layout alongside the percentage; it is a sample estimate, not a wall-to-wall map.
What’s actually slowing this PC down?
Pick the symptom - the matching free tool is one click away.
4. When to use imagery instead
Imagery can be useful for broad coverage or repeat monitoring, but specify the dataset, spatial resolution and year. The USDA Forest Service Tree Canopy Cover products include 30-metre Landsat- and Sentinel-2-based datasets for several US geographies. The 2025.6 suite, released in 2026, includes modeled canopy cover and standard error for 1985–2025. Check the product’s geographic coverage and select the appropriate layer: modeled cover and standard error are distinct outputs.
Rank #3

- Comprehensive Package: the package includes 2 aluminum tree calipers, providing exceptional value and convenience, enough for your daily use and replacement, and you can also share with your friends or family, ensuring you're always prepared and equipped to tackle any measuring job
- Sized Just Right: our weather resistant tree caliper measures diameter in inches on one side, up to 8 inches (0 to 8 inches, marked every 1/ 2 inch), and in centimeters on the other side, up to 20 centimeters, allowing for precise measurements every time
- Quality You Can Trust: quality meets durability with our tree caliper, made from aluminum, rugged and durable, with a long service life, ensuring sustained performance and reliability, built to withstand daily use without compromising accuracy
- Easy to Use: the aluminum tree caliper is engineered for ease of use, unaffected by weather or climate; Its robust yet lightweight aluminum construction makes it easy to carry; The easy-to-read scale allows for quick and accurate measurements
- Wide Uses: aluminum tree caliper is primarily used to measure the diameter of trees at breast height (about 1.3 meter above the ground), a professional tool in forestry surveys, forest resource inventory, and scientific research measurements; It can also measure tree diameter, hose diameter, onion size, and the dimensions of various fruits and vegetables; It is widely used in forest management, afforestation and tending, ecological research, teaching and training, tree growth assessment
A 30-metre pixel product describes cover at that pixel scale; it is not interchangeable with a fine-grained field observation. It also does not provide a count of individual trees. Do not present satellite canopy estimates as if they were a direct field tally.
5. Report results so they can be repeated
A useful record lets another person understand the estimate and repeat the work. Include:
Rank #4
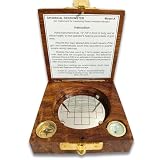
- Accurate Measurement: This spherical crown densiometer allows for precise measurement of crown density and canopy cover in forestry applications.
- Durable Construction: Made with high-quality, convex materials to withstand rugged field conditions.
- Compact and Portable: Lightweight and compact design for easy transport and use in remote locations.
- User-Friendly: Features a simple, intuitive operation for quick and reliable readings.
- Versatile Application: Suitable for various forestry tasks, including tree inventory, ecological studies, and forest management.
- Woodland boundary and mapped area.
- Survey date and tree inclusion rule.
- Whether the tree count is a complete tally or a sample-based estimate.
- For sampling: plot layout, plot size and number, and how the woodland-wide estimate was calculated.
- For canopy: field transect or point layout, instrument if used, or imagery product, resolution and data year.
- Uncertainty for sample-based estimates where it has been calculated, plus relevant limitations.
Keep the method consistent when monitoring change. Forest Service research notes that estimates can vary substantially among field measurement, imagery and active-sensing methods; changing methods can look like ecological change even when it is not. See USDA Forest Service research on canopy measurement.
Quick wins for a faster PC:
Clear out junk files and repair common Windows errorsFree Scan →Fix the driver behind crashes, sound loss and screen glitchesFind Drivers →Repair Windows errors before they cause bigger problemsFix Now →Great Britain woodland criteria are a local example
Administrative definitions are not universal measurement standards. In Great Britain, the National Forest Inventory describes woodland as at least 0.5 hectares and 20 metres wide, with at least 20% canopy cover or potential to achieve it. UK government guidance also gives 100 evenly spaced stems per hectare as a normal starting presumption for achieving 20% canopy cover, while noting that species composition affects the density needed. These are Great Britain-specific classification criteria and presumptions, not general ecological thresholds. Consult Forest Research’s NFI information and UK government guidance for their context.
Quick Recap
Best Value

- Use ; To Determine Forest overstory density or as one indicator in wetland delineation work
- Convex Model A
- .Built-in leveling bubble
- Operating instructions included
- Made In INDIA Product by Finest Indian Craftsmen
Product prices and availability are accurate as of the date/time indicated and are subject to change. Any price and availability information displayed on Amazon at the time of purchase will apply.

