Measure a data center in a defined boundary, align whole-facility and IT energy data to the same periods, calculate PUE consistently, then add cooling, electrical-loss, workload, carbon, water, or reuse metrics that answer the decision in front of you. The largest savings cannot be named reliably before those measurements exist: IT load, cooling design, climate, resilience requirements, and distribution losses differ by site.
Start with a measurement plan, not a savings guess
A credible energy assessment follows a sequence: define what belongs inside the data-center boundary; install or identify meters at defensible points; collect time-aligned data; calculate PUE; add system and workload metrics; investigate the largest measured users and losses; implement changes without compromising availability; and verify the result against a baseline.

As an Amazon Associate I earn from qualifying purchases.
This approach matters because a low ratio or a promising efficiency measure can be misleading when the numerator, denominator, time period, workload, or operating conditions are different. A general guide can identify opportunity areas, but it cannot honestly predict the largest saving for an unmeasured facility.
Free tools Windows power users keep installed
One-click scans. No signup required.
Define the energy boundary before installing meters
Dedicated data centers
For a dedicated facility, the recommendations in the U.S. Department of Energy (DOE) and its multi-organization task force place total data-center energy at the utility handoff to the owner or operator. Draw that boundary on a one-line diagram and list every included energy flow: IT rooms, cooling plant, pumps and fans, lighting, controls, security, and operational support infrastructure. Record the meter point and the reporting period in the procedure that will be used for every PUE report. DOE’s Recommendations for Measuring and Reporting Overall Data Center Efficiency, Version 2 provides the boundary guidance.
Mixed-use buildings
When the data center shares a building, include the energy required to operate the data-center function rather than silently assigning the whole building to it. State how shared chillers, electrical rooms, lighting, offices, and other systems are allocated. If an allocation is estimated, document the method and its uncertainty. A PUE number without this explanation is not comparable with a number from a dedicated facility.
Write down exclusions and assumptions
- Identify the utility or upstream meter that supplies the facility.
- List shared equipment and the rule used to apportion its energy.
- Specify whether generators, battery charging, renewable production, heat-recovery equipment, or tenant systems are included.
- Use one set of units and one reporting calendar for total and IT energy.
- Keep meter accuracy, range, calibration status, data gaps, and estimation rules with every data set.
Calculate PUE with matching numerator and denominator
Power Usage Effectiveness is the ratio of total data-center energy to IT-equipment energy:
PUE = total data center energy ÷ IT equipment energy
Do these 3 things before closing this tab:
1Scan for outdated or missing drivers - takes under a minute2Clear out junk files and repair common Windows errors3Fix the driver behind crashes, sound loss and screen glitchesUse energy in the same units (for example, kilowatt-hours) and the same interval for both terms. If total energy is a monthly value and IT energy is a daily average, the quotient does not describe a valid month. State the boundary, meter locations, interval, and treatment of estimates beside every published value.
Where to measure IT energy
DOE’s recommendations call for IT consumption to be measured at least at the output of the uninterruptible power supply (UPS). They encourage progression toward direct measurement at the IT load, including servers, storage, and network equipment. UPS-output measurement is often a practical starting point; direct equipment measurement can reveal differences among racks, workloads, and device classes that the upstream denominator hides.
Rank #2

- Superior Charging Performance Monitoring: Monitor the charging performance of all USB and Type C devices, including wall and solar panel chargers as well as USB cables. This tester can accurately measure voltage (3.6V-32V) and current (0-8.0A), making it ideal for assessing power bank capacity and electric energy.
- Broad Compatibility with Quick Charging Protocols: Supports the latest PD and QC fast-charging protocols, including PD3.0/2.0, QC3.0/2.0, and BC1.2. Compatible with a wide range of devices, from the newest iPhone 16 Pro to MacBook Pro, Dell XPS, Chromebook, Surface Pro, and more, ensuring versatility across USB A and Type C ports.
- Comprehensive Safety Protections: Equipped with over-voltage, over-current, under-voltage, and low energy protection. This tester automatically cuts off power if it detects any issue, preventing damage to your devices. It also saves data during sudden power outages, preserving valuable information.
- IPS Color Display with Easy Interface Navigation: This upgraded USB tester features a vivid, high-resolution display with eight color-screen interfaces. Easily switch views to monitor voltage, current, capacity, power, load impedance, and more, all in one glance.
- Precise Power Bank Capacity Testing: Accurately test power bank capacity either by direct load testing or by calculation. To determine capacity, charge the power bank fully and divide the Wh reading by battery voltage (e.g., 35Wh ÷ 3.7V = 9.46Ah or 9460mAh), offering reliable insight into actual capacity.
What PUE can and cannot tell you
PUE describes facility overhead relative to IT energy. It does not measure useful computing work, carbon emissions, water use, renewable supply, or exported heat. A site could improve PUE while serving less useful work, or maintain PUE while cutting carbon through a cleaner electricity supply. Select additional indicators for those questions instead of forcing PUE to answer them.
DOE’s 2019 guidance uses PUE 2.0 as average-efficiency context and notes that highly efficient data centers have approached the theoretical minimum of 1.0. Those statements are context from that guidance, not a guarantee that a current facility can reach a particular value. See DOE’s cooling-water efficiency guidance.
Build a meter architecture that answers decisions
Metering is useful for more than an annual report. DOE identifies energy-cost tracking, bill checking, capacity planning, benchmarking, identification of large users, validation of efficiency strategies, and diagnosis of physical-system faults as practical uses. Begin with whole-facility and IT measurements, then add end-use meters where a decision requires them. DOE’s Data Center Metering and Resource Guide describes this planning approach.
Minimum useful points
- Total facility: the utility handoff or an equivalent boundary meter.
- IT load: at least UPS output, with a roadmap toward rack, power-distribution-unit (PDU), or equipment measurement.
- Cooling: chiller or packaged-unit power, pumps, cooling towers or dry coolers, and the associated cooling-load measurement where available.
- Electrical distribution: transformers, UPS input and output, and PDUs when conversion or distribution losses need to be separated.
- Environmental conditions: temperature, humidity, pressure, airflow or differential pressure, and selected rack or room locations that represent operating risk.
DOE specifically notes that monitoring along the electrical chain can expose losses in transformers, UPS systems, and PDUs. Meter every point only when the data will change a decision; unnecessary instrumentation adds integration and maintenance work without improving prioritization.
Specify measurement quality
For each meter, define the expected current or power range, accuracy, sampling interval, communications method, calibration status, and treatment of missing data. A meter that is accurate only near full scale can obscure low-load behavior; a short-lived spot reading cannot establish a seasonal baseline. Keep timestamps synchronized across utility, IT, cooling, and weather data so that changes can be compared on the same operating interval.
Rank #3

- BQHHWTZ AMC16Z-FAK Multi-Channel AC/DC Energy Meter for 1Phase 3Phase System with RS485 Modbus-RTU
Use assessment kits appropriately
DOE’s Data Center Energy Efficiency Measurement Assessment Kit Guide and Specification explains measurement components and data used to estimate PUE and screen HVAC and electrical opportunities. It is a screening and prioritization aid, not a detailed audit procedure or a calculator that proves savings. Treat its outputs as a reason to investigate further, not as a guaranteed project value.
Collect a baseline that explains operating conditions
Choose a baseline long enough to capture normal workload and environmental variation. Log total and IT energy at the same interval, then join those records to cooling loads, supply and return temperatures, humidity, outdoor weather, equipment status, alarms, and workload or utilization data where available. Mark outages, maintenance, commissioning, unusual weather, and major workload migrations rather than averaging them away.
Check the data before calculating trends
- Compare meter totals with utility bills or known equipment ratings.
- Look for impossible negative values, flat-lined channels, missing intervals, clock shifts, and step changes after meter replacement.
- Confirm that power-factor, phase, and three-phase readings are handled consistently by the meter and data system.
- Keep a change log for firmware updates, sensor moves, set-point changes, and equipment additions.
- Flag estimated intervals and report the estimation method.
Use like-for-like comparisons. A cooling change measured during a mild week and a light IT load cannot be credited solely to the change without accounting for weather and demand.
Add metrics that answer the next question
DOE’s 2024 Best Practices Guide for Energy-Efficient Data Center Design points to the ISO/IEC 30134 KPI family. Choose only the indicators that match the decision being made.
| Question | Useful metric | Interpretation |
|---|---|---|
| How much facility overhead supports IT? | PUE | Total data-center energy divided by IT energy, with stated boundaries. |
| How efficiently does cooling deliver capacity? | Cooling-system power per cooling load (kW/ton) | Trend with cooling load, weather, and operating mode; do not treat a benchmark as a universal target. |
| How much computing capacity is being used? | Server utilization and server energy efficiency | Provides workload context that PUE lacks. |
| What is the climate impact? | Carbon Usage Effectiveness (CUE) | Use emissions factors and accounting boundaries appropriate to the electricity supply. |
| What is the water impact? | Water Usage Effectiveness (WUE) | Include the water boundary and source assumptions. |
| Is energy being productively reused? | Energy Reuse Factor (ERF) | Measure useful exported energy under a defined boundary. |
| How much supply is renewable? | Renewable Energy Factor (REF) | State whether the accounting is on-site, contracted, or another defined basis. |
For cooling, DOE’s 2024 guide gives example benchmark columns of 1.1 kW/ton as “standard,” 0.8 kW/ton as “good,” and 0.6 kW/ton as “better.” These are guide examples, not guaranteed targets: climate, equipment type, part-load behavior, water availability, and resilience requirements can make a different value appropriate.
Rank #4

- 1.Digital Multimeter:This power energy meter can measure and display voltage current active power energy frequency and power factor at the same time.with split current transformer,more convenient to install
- 2.Overload Alarm function:Backlight and power will flash simultaneously to give an alarm when exceeding the preset value.You can preset power limit by yourself
- 3.Automatic Data Storage Function:The last test data is stored automatically when the power supply abruptly lose. Don't worry about data loss due to sudden power outages
- 4.One-touch Control:The button can be used to control the backlight,reset energy, preset power alarm limit
- 5.LCD Display:Large-screen LCD with all sight 180° view,The blue backlight can be turned on/off manually. PZEM-022 requires an external power supply to light up the screen
Investigate the main opportunity areas as one system
DOE organizes efficiency opportunities into IT systems and environmental conditions, data-center air management, cooling and electrical systems, and heat recovery. They interact: reducing IT power can reduce cooling and distribution energy, while an airflow or set-point change can alter fan, chiller, UPS, and reliability performance. Evaluate the chain rather than crediting each secondary effect independently.
IT systems and environmental conditions
Establish the IT denominator first. Examine equipment efficiency, server utilization, refresh or consolidation plans, idle capacity, power-management settings, and operating temperatures within approved reliability limits. Keep useful-work or service-level information alongside energy: a lower IT reading is not automatically a saving if it reflects lost capacity or reduced service.
Air management
Map supply and return temperatures, humidity, pressure, airflow, and rack-level conditions. Look for bypass air, recirculation, blocked tiles, leaks, poor containment, fan over-speed, and hot spots that trigger excessive cooling. DOE’s assessment-kit material describes environmental maps and monitoring points as tools for locating cooling-performance deficiencies. Correcting airflow can reduce fan and cooling demand, but validate that every rack remains within the approved environmental envelope.
Cooling systems
Trend cooling power against cooling load, outdoor conditions, water temperature where relevant, and IT demand. Separate chiller, compressor, pump, fan, tower, and control energy when the plant design allows it. Check sequencing, set points, economizer operation, variable-speed controls, fouled heat exchangers, and simultaneous heating and cooling. Compare equivalent weather and load conditions before assigning an improvement to a project.
Outdated Drivers Are Slowing You Down
One free scan finds every outdated or missing driver and matches the right update for your exact hardware.Free scan · exact hardware matchPC Slower Than It Used to Be?
A free scan shows the junk files, broken settings and background clutter dragging Windows down - then fixes them in one click.Free scan · Windows 10 & 11Electrical distribution
Use measurements at transformer, UPS, and PDU stages to distinguish delivered IT energy from conversion and distribution losses. Investigate lightly loaded or inefficient equipment, abnormal phase imbalance, poor power factor where it creates losses or penalties, and operating modes that keep redundant equipment energized. Reliability and fault-tolerance requirements set the limits: never disable redundancy or bypass protection solely to improve a ratio.
Best Value
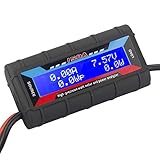
- Bright blue backlit LCD display, easy reading. 12 gauge wire take higher volt and current. It is indispensable for analyzing, testing and troubleshooting any DIY DC power project. Very accurate in giving DC volt, ampere and wattage
- Operates from 4.8V to 60V or 0V to 60V with optional auxiliary battery. Measures 0-150A, resolution 0.01A; Measures 0-60V, resolution 0.01V; Measures 0-6554W, resolution 0.1W; Measures 0-65Ah, resolution 0.001Ah; Measures 0-6554Wh, resolution 0.01Wh
- Measuring Current (A), Voltage (V), Watts (W), Amp-hours (Ah), Watt-hours (Wh), Peak Amps (Ap), Minimum Volts (Vm), Peak Watts (Wp). Widely application battery tester, can test Solar Power batteries and chargers
- Multifunctional Tester: Evaluate RC battery charging efficiency.Measure power and energy consumption of any battery powered device. Predict model airplane flight time,Choose the best propeller/most efficient motor .Check for wiring and connector power loss.Ensure peak currents are safe for motor, ESC & Battery as well as wiring and connectors
- Notice: This watt meter was designed to be safe in systems unsing less than 60V and carrying current up to 150A. DO NOT EXCEED THE LIMITES
Heat recovery and broader objectives
Where a nearby, year-round thermal demand exists, assess the useful energy that could be recovered from cooling systems or other sources. Measure exported heat and the receiving system so that an energy-reuse claim reflects delivered value. Use CUE, WUE, or ERF when carbon, water, or reuse is the objective; PUE alone cannot represent those outcomes.
Independent reader supportYour contribution helps us test, update, and keep practical guides available for everyone.Rank projects with measured evidence and risk controls
After screening, create a project register. For each candidate, record the measured baseline, affected load, operating change, capital and labor requirements, expected maintenance, reliability impact, implementation window, and verification method. Rank candidates using:
- Magnitude: how much measured energy the affected system uses and how often it operates.
- Achievability: the controllable operating range and engineering constraints.
- Reliability: redundancy, failover, environmental limits, and service-level obligations.
- Cost and effort: design, installation, controls integration, commissioning, and ongoing maintenance.
- Interactions: secondary savings or penalties in IT, airflow, cooling, electrical, carbon, and water systems.
- Verification: whether the baseline and meters can isolate the change.
This ranking is a decision framework, not a universal leaderboard. A site-specific savings estimate should be prepared by an experienced data-center energy auditor using suitable measurement and verification.
Implement changes in controlled stages
- Document the baseline: freeze the meter configuration, operating settings, workload indicators, and environmental limits for the comparison period.
- Commission the measurement: confirm readings against independent checks and verify timestamps, alarms, and data completeness.
- Test a reversible change: adjust one control strategy or operating parameter within approved limits before making a permanent change.
- Watch reliability indicators: track rack temperatures, humidity, pressure, UPS state, alarms, cooling capacity, and service metrics during the test.
- Compare matched conditions: normalize or stratify results by IT load, weather, and operating mode instead of comparing unlike days.
- Approve and roll out: update operating procedures, control sequences, and maintenance plans only after the test meets energy and resilience criteria.
Verify savings against the baseline
Verification should use the same boundary and meter definitions as the original assessment. Compare total energy, IT energy, PUE, and the project-specific metric over an agreed period. For cooling, include cooling load and weather; for IT changes, include workload or utilization; for distribution projects, use upstream and downstream meters to separate delivered-load changes from loss reductions.
Report the result with the measurement interval, data quality, normalization method, uncertainty, and any concurrent changes. If several projects overlap, do not add their claimed savings without accounting for interactions. A measured reduction that cannot be reproduced under comparable conditions is an observation, not a durable savings claim.
How to compare two facilities or proposals fairly
| Comparison axis | What to document |
|---|---|
| Boundary and meter point | Utility handoff, shared-system allocation, IT meter location, and included end uses. |
| Period and load | Reporting interval, season, IT demand, workload, utilization, and abnormal events. |
| Outcome metric | PUE, cooling kW/ton, server utilization, ERF, CUE, WUE, or another stated KPI. |
| Physical conditions | Climate, cooling architecture, temperature and humidity ranges, and facility design. |
| Reliability constraints | Redundancy, resilience tier, maintenance windows, and service-level requirements. |
| Evidence and economics | Measured baseline, expected cost, implementation effort, uncertainty, and verification plan. |
DOE’s guide uses scenario-specific recommendations because there is no single best design for every data center. A proposal that looks better on PUE may not be better for a different climate, workload, water constraint, or resilience requirement.
Use current guidance without treating it as a code
The 2024 DOE design guide includes monitoring practices and recognized KPI families. The PNNL/ASHRAE/NEMA AI Data Center Energy Performance Framework extends the discussion to planning, design, operation, retrofit, grid-interactive design, commissioning, and performance validation. ASHRAE describes that framework as guidance; it does not establish mandatory requirements or supersede applicable codes and standards. Its page says updates are expected as AI technology, grid conditions, and regulations evolve, so check the current edition before using it for detailed design decisions.
Quick wins for a faster PC:
Scan for outdated or missing drivers - takes under a minuteDriver Scan →Clear out junk files and repair common Windows errorsFree Scan →Fix the driver behind crashes, sound loss and screen glitchesFind Drivers →What published program results do—and do not—prove
The DOE Data Center Accelerator Toolkit reports 21 participating partners, an average 36% improvement in infrastructure energy intensity, and $3.9 million in annual cost savings. DOE defines infrastructure energy intensity for this program as PUE minus one. These are results attributed to the Accelerator partners and program; they are not a forecast for an individual facility. Your baseline, climate, equipment, load, and operating constraints determine the attainable result.
Quick Recap
Common measurement mistakes to avoid
- Mixing boundaries: comparing a utility-level numerator with a UPS-output denominator from another facility.
- Mixing periods: dividing monthly total energy by a shorter IT sample.
- Using PUE as a productivity score: omitting utilization, useful work, carbon, water, or reuse metrics.
- Chasing a benchmark blindly: treating 0.6 or 0.8 kW/ton as a universal cooling target.
- Ignoring part load and weather: crediting a project for a mild day or reduced workload.
- Over-metering without a decision: collecting channels that no one will analyze or maintain.
- Calling a screening result an audit: using an assessment-kit estimate as a guaranteed savings calculation.
- Trading resilience for efficiency: changing redundancy, environmental limits, or protection settings without a documented risk review.
A practical decision checklist
- Have the facility and IT boundaries been drawn and approved?
- Are total and IT energy measured at documented points with matching intervals and units?
- Can the data be reconciled to bills, equipment ratings, and calibration records?
- Do cooling, electrical, environmental, workload, and weather data align with the energy series?
- Which KPI answers the decision: PUE, cooling kW/ton, utilization, CUE, WUE, ERF, or REF?
- Have airflow, cooling, distribution, and IT interactions been considered together?
- Does each proposed action have a baseline, reliability review, implementation plan, and verification method?
- Is a qualified auditor needed for the site-specific savings estimate?
Product prices and availability are accurate as of the date/time indicated and are subject to change. Any price and availability information displayed on Amazon at the time of purchase will apply.

