Quick wins for a faster PC:
Scan for outdated or missing drivers - takes under a minuteDriver Scan →Repair Windows errors before they cause bigger problemsFix Now →An agent run can return a clean HTTP response and still be wrong: a tool may never have run, a handoff may have gone to the wrong specialist, a guardrail may have stopped the workflow, or a model may have produced an incomplete answer. A trace harness makes that failure visible by recording one end-to-end trace with nested spans for each meaningful operation.
The practical method is simple: attach a correlation ID to the logical run, capture timed child spans, export the finished trace, and inspect the first missing, failed, or unexpectedly slow operation. A trace only helps when the relevant work is instrumented, export has completed, and recorded fields are detailed enough to distinguish a model problem from a tool, handoff, policy, runtime, or instrumentation problem.
As an Amazon Associate I earn from qualifying purchases.
What a “quiet failure” looks like
An explicit exception is comparatively easy to investigate: the application receives an error, a stack trace is written, and a monitoring rule can alert on it. A quiet failure has a different shape. The run technically completes, but the result is incomplete, incorrect, or unexplained at the application boundary.
- The agent answers without performing a tool call that the task required.
- A tool runs but returns an empty, stale, or malformed result that is not surfaced to the caller.
- A handoff reaches a different agent than intended, yet the final response still has a success status.
- A guardrail or policy step stops the workflow and the user sees only a generic response.
- The model produces a plausible answer while omitting one required part of the task.
- The run appears to have no diagnostic record, so you cannot tell whether work was skipped or merely not recorded.
These are operational descriptions, not a published failure-rate taxonomy. There is no reliable prevalence figure to attach to them. The important distinction is between the outcome visible to the caller and the work that actually occurred inside the run.
#1 Best Overall

- 【High-Speed 8-Channel Analysis】Captures digital signals at up to 24MHz across 8 channels, enabling precise debugging of complex protocols like I2C, SPI, and UART—ideal for advanced STEM projects without the limitations of basic 4-channel models.
- 【User-Friendly Design】Base module and breakout board simplify connections to breadboards, microcontrollers, and other setups.
- 【Logic Level Expansion Board】Breaks out all 8 channels to 2.54mm male pins and pads for alligator clips, enabling flexible and secure connections in diverse projects.
- 【Logic Level Breadboard Adapter】 Easily connects the logic analyzer to breadboards, providing direct and convenient access to all 8 channels for prototyping and testing.
- 【Dual USB Connectivity】Comes with both USB-A and Type-C cables for universal compatibility with older PCs, modern laptops, and devices, ensuring hassle-free plug-and-play across Windows, Mac, Linux, and Ubuntu.
Trace versus span: the shape you need to inspect
A trace is the run-level container for one logical operation. A span is a timed, named operation inside that trace. Spans can be nested, so a parent operation can contain the model generation, tool execution, handoff, guardrail, or custom code that made up the step.
The following is an illustrative hierarchy, not a requirement that every framework use these exact names:
| Level | Illustrative operation | What it answers |
|---|---|---|
| Trace | Customer-support run 8f2… | Which end-to-end request is being investigated? |
| Agent turn | Planner turn | Which decision cycle was active? |
| Generation | Model response | What instructions and context reached the model, and what did it return? |
| Function | Search-order tool | Was the tool invoked, how long did it take, and what did it return? |
| Handoff | Route to billing agent | Did control move to the intended specialist? |
| Guardrail | PII output check | Did a policy check allow, modify, or stop the result? |
| Custom step | Normalize account data | What happened in application code that the framework does not instrument automatically? |
OpenAI’s Agents SDK documents task, agent, turn, generation, function, guardrail, and handoff span categories. Other frameworks may represent the hierarchy differently, so compare the meaning of an operation rather than assuming identical names. The useful invariant is a parent-child relationship with timing and status.
Recommended Free Tools
Build the minimum useful harness
Start with a small record that can answer “which run was this, what happened first, and where did it diverge?” Do not begin by capturing every prompt and response. Capture enough context to identify the input, tool, transition, or code path, while following your organization’s data policy.
Rank #2

- ✅ High-Performance 16-Channel Logic Analyzer: Cost-effective LA1010 USB logic analyzer with 16 input channels and 100MHz sampling rate per channel, featuring portable design and included KingstVIS PC software.
- 🌐 Real-Time Signal Visualization: Simultaneously capture 16 digital signals and convert them into clear digital waveforms displayed instantly on your PC screen for precise analysis.
- 🔍 Protocol Decoding & Data Extraction: Decode 30+ standard protocols (I2C, SPI, UART, CAN, etc.) to extract human-readable communication data, accelerating debugging.
- 🛠️ Multi-Application Tool: Ideal for developing/debugging embedded systems (MCU, ARM, FPGA), testing digital circuits, and long-term signal monitoring with low power consumption.
- 💻 Cross-Platform Compatibility: Supports Windows 10/11 (32/64bit), macOS 10.12+, and Linux – drivers auto-install, no configuration needed.
1. Create one correlation ID per logical run
Generate or accept a run identifier at the boundary where the user request, job, or workflow begins. Pass it through agent turns, tool adapters, queues, and handoffs. A request ID that changes at every internal call cannot reliably connect the child operations back to the user-visible failure.
2. Record the span lifecycle
Each span needs a start time, an end time or duration, a status, and a parent reference. Use a stable operation name such as model.generation, tool.search_orders, or handoff.billing. Mark an operation failed when it raises an exception or violates a contract; do not infer success merely because the parent process continued.
3. Add safe debugging context
Useful attributes include the agent or component name, model-generation label, tool name, handoff target, input and output identifiers, and a bounded error message. If payload capture is permitted, record the relevant inputs and outputs. If it is not, store hashes, redacted excerpts, schema-validation results, or references to a controlled log instead. The OpenAI Agents API tracing documentation describes recorded inputs, outputs, duration, and status, but no backend should be assumed to record every field by default.
Do these 3 things before closing this tab:
1Scan for outdated or missing drivers - takes under a minute2Repair Windows errors before they cause bigger problems3Fix the driver behind crashes, sound loss and screen glitches4. Close and export deliberately
Do not treat “the handler returned” as proof that the trace was persisted. Finish child spans, finish the parent trace, and wait for the exporter’s buffered work to be flushed according to the framework’s lifecycle. Then verify that the trace is visible in the expected viewer or available through the documented export path.
Rank #3

- The logic for each channel sampling rate of 24M/s. General applications around 10M, enough to cope with a variety ofoccasions; 8-channel
- Sampling rate up to: 24 MHz , can be 24MHz. 16MHz, 12MHz, 8MHz, 4MHz, 2MHz, 1MHz, 500KHz, 250KHz, 200KHz, 100KHz, 50KHz, 25KHz;
- The logic for each channel sampling rate of 24M/s. General applications around 10M, enough to cope with a variety ofoccasions;
- Input voltage range: -0.5V to 5.25V; Input Low Voltage: -0.5V to 0.8V; Input High Voltage: 2.0V to 5.25V
- Input Impedance: 1Mohm || 10pF (typical, approximate); Crystal: +/-20ppm, 24MHz
A framework-neutral event shape might look like this:
{
  "trace_id": "8f2…",
  "span_id": "a31…",
  "parent_span_id": "7c0…",
  "operation": "tool.search_orders",
  "start": "2026-10-18T12:00:01Z",
  "duration_ms": 184,
  "status": "error",
  "attributes": {
    "tool": "search_orders",
    "request_id": "req-42",
    "input_ref": "redacted",
    "error_type": "timeout"
  }
}
The field names above are illustrative. Use the schema and exporter supported by your framework, and keep the parent-child links intact.
Debug from the outside in
When a user reports an unexplained result, follow the same order every time. It prevents a common mistake: debugging the model before confirming that a trace exists and represents the work you think it represents.
- Confirm tracing is enabled. Check the runtime, environment, and run configuration first. The OpenAI Agents SDK documentation says tracing is enabled by default in its documented server runtimes, disabled by default in browsers and when
NODE_ENV=test, and unavailable for organizations using OpenAI APIs under a Zero Data Retention policy. Your framework may have different defaults. - Confirm export completed. Look for the finished trace in the expected dashboard or use the documented session-trace export API. A buffered exporter can lose the tail of a run if the process exits before flushing. If no trace is visible, distinguish “not exported” from “no work occurred.”
- Open the run-level record. Check the overall status, start time, end time, and duration. A long parent duration narrows the time window, but it does not identify the responsible child operation.
- Find the first abnormal span. Walk the children in execution order. Look for the first failed status, a missing expected operation, an unexpectedly long duration, or an output that violates the next step’s input contract.
- Compare parent and child details. A successful parent can contain a failed tool call that was caught, retried, or replaced with a fallback. Compare the model-generation input and output, tool arguments and result, handoff target, and guardrail decision when policy permits. Span-level detail is what lets you separate a model decision from an execution or routing problem.
- Check coverage when the trace is incomplete. Review whether the missing operation is instrumented, whether content recording is enabled where needed, and whether the framework’s semantic-convention settings are configured. Microsoft’s tracing guidance identifies disabled content recording, unset semantic-convention configuration, and uninstrumented operations as causes of missing or incomplete spans.
- Reproduce under controlled conditions. Once you have a suspected boundary, rerun with a known input, a deterministic test fixture for the tool, and the same tracing configuration. Compare traces rather than relying on the final text alone.
How to read the first bad span
Model generation is the first abnormal span
Check the exact instructions and context supplied to that generation, the requested output format, and whether the returned content satisfies the schema expected by the next step. If the generation is present, fast, and marked successful but omits a required action, the evidence points toward prompting, context selection, model behavior, or validation rather than exporter failure. Keep that conclusion qualified: a trace can show what was recorded, not prove that unrecorded context did not influence the model.
Rank #4
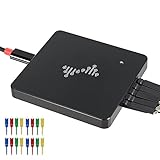
- 16 channels dual-mode support: ①Stream mode captures and transfers data in real time for long sample duration; ②Buffer mode captures and stores data temporarily for high sample rate
- USB 2.0 Type-C interface with up to 16G sample depth in stream mode
- Support for adjustable threshold and shielded wires for a better, cleaner waveform
- 256Mbits on-board SDRAM memory with multiple buffer modes
- Compatibility with WinXP-Win10, macOS, and Linux, supporting nearly 100 protocol decoders, and being open-source on Github
A tool span is missing
First verify that the model actually selected the tool. If the generation requests a function but no function span follows, inspect the dispatcher, tool-registration code, and instrumentation boundary. If no tool request appears in the generation output, the issue is earlier in planning or model behavior. If a tool span exists but has no payload, content recording may be disabled or redaction may be active.
The tool span fails or runs unusually long
Use the duration and status to distinguish a timeout, a rejected argument, an upstream error, and a slow but successful call. Compare the recorded arguments with the tool’s contract. A model can be correct to call a tool while the adapter, credentials, network, or downstream service fails.
A handoff or guardrail span diverges
Inspect the selected destination, the reason or metadata recorded for the transition, and the policy result. A handoff to an unexpected agent is a routing problem even when the final agent returns valid text. A guardrail that blocks output may be working as designed; the debugging question is whether the input and policy configuration matched the intended case.
Only the parent span exists
Do not conclude that the agent did no internal work. The operation may be outside the framework’s automatic instrumentation, export may have stopped before child spans were flushed, or content and semantic-convention settings may suppress details. Add explicit spans around custom code and verify export with a small controlled run.
Best Value

- ★The logic for each channel sampling rate of 24M/s. General applications around 10M, enough to cope with a variety ofoccasions; 8-channel.
- ★Sampling rate up to: 24 MHz , can be 24MHz. 16MHz, 12MHz, 8MHz, 4MHz, 2MHz, 1MHz, 500KHz, 250KHz, 200KHz, 100KHz, 50KHz, 25KHz.
- ★Input voltage range: -0.5V to 5.25V; Input Low Voltage: -0.5V to 0.8V; Input High Voltage: 2.0V to 5.25V.
- ★Input Impedance: 1Mohm || 10pF (typical, approximate); Crystal: +/-20ppm, 24MHz.
- ★UART, SPI, IIC and other communication debugging, let you get twice the result with half the effort. 24M sampling rate, can automatically analyze UART, IIC, SPI and many other standard protocols.
Built-in tracing and OpenTelemetry-oriented setups
There is no documented basis for declaring one approach universally superior. Choose according to the coverage and controls your system requires.
| Decision axis | Built-in framework tracing | OpenTelemetry-oriented setup |
|---|---|---|
| Framework coverage | Often knows about that framework’s model, tool, handoff, and guardrail operations. | Can unify agent spans with broader application telemetry, but coverage depends on instrumentations and adapters. |
| Debugging fields | May expose framework-specific inputs, outputs, duration, and status in its viewer. | Can carry standard span attributes; emitted agent detail depends on the framework integration and configuration. |
| Export and viewing | Usually follows the framework’s exporter and dashboard or session-trace workflow. | Can route telemetry through an OpenTelemetry collector and compatible backends; viewer availability depends on your deployment. |
| Configuration effort | Often lower for the operations the framework instruments automatically. | Requires configuring SDKs, exporters, semantic conventions, and any agent-specific instrumentation. |
| Missing-span diagnosis | Check runtime defaults, export lifecycle, and framework instrumentation. | Also check instrumentation registration, collector delivery, semantic conventions, and sampling. |
| Data controls | Use the framework’s content-recording switches and organizational policy settings. | Apply attribute filtering, redaction, sampling, and retention controls across the telemetry pipeline. |
Microsoft’s Agent Framework documentation describes OpenTelemetry integration that can emit traces, logs, and metrics. That establishes a compatible observability approach, not a performance ranking against the OpenAI Agents SDK or any other framework.
Privacy, policy, and operational limits
Inputs and outputs can contain credentials, personal data, proprietary prompts, or customer records. Before enabling payload capture, determine what your organization permits, who can view traces, how long they are retained, and whether they leave the environment. Use redaction or references when full content is unnecessary for diagnosis.
The Tool Desk
Outbyte Driver Updater FREEScan for outdated or missing drivers - takes under a minuteDriver Scan →Outbyte PC Repair FREERepair Windows errors before they cause bigger problemsFix Now →Content recording is a configuration choice, not a guarantee. A trace may correctly show timing and status while omitting payloads. Conversely, enabling payloads can make a trace more useful and more sensitive. Under the OpenAI Agents SDK documentation, organizations using OpenAI APIs with a Zero Data Retention policy cannot use that SDK tracing capability. Treat that as a product and policy constraint, not as evidence that tracing is impossible in every architecture.
A repeatable quiet-failure checklist
- Record the user-visible symptom and the run or correlation ID.
- Verify that tracing is enabled for the actual runtime and environment.
- Finish and flush the trace; confirm it appears in the dashboard or export.
- Inspect overall status, start time, end time, and duration.
- Locate the first missing, failed, or unexpectedly slow child span.
- Compare model, tool, handoff, guardrail, and custom-operation details where policy allows.
- Check instrumentation coverage, content-recording settings, and semantic-convention configuration.
- Reproduce with controlled inputs and compare the resulting trace.
A trace harness does not prevent a model from making a bad decision. It gives that decision a place in an observable sequence, alongside the tool calls, handoffs, guardrails, and runtime work that followed. That distinction is what turns an unexplained final response into a specific engineering investigation.
Further reading
For background on distributed tracing concepts such as instrumentation, collection, analysis, sampling, and context propagation, Distributed Tracing in Practice by Austin Parker, Daniel Spoonhower, Jonathan Mace, Ben Sigelman, and Rebecca Isaacs was published by O’Reilly in April 2020. Use current framework documentation for agent-specific behavior and configuration.
Quick Recap
Product prices and availability are accurate as of the date/time indicated and are subject to change. Any price and availability information displayed on Amazon at the time of purchase will apply.

