Recommended Free Tools
Start with the U.S. Bureau of Economic Analysis (BEA) Regional Price Parities (RPPs) for a same-year comparison, then price the housing and other expenses your household is likely to face in the specific destination. Finally, compare those costs with realistic local income and take-home pay, and keep one-time moving expenses separate. A state average is a useful baseline—not a prediction of your personal bills.
Start with a consistent state-level benchmark
The BEA’s Regional Price Parities measure price-level differences between states and metropolitan areas for a given year, expressed as a percentage of the national price level. In plain terms, 100 is the national average; an RPP of 110 means the area’s average price level was 10% above it for that year. See the BEA’s Regional Price Parities data.
As an Amazon Associate I earn from qualifying purchases.
The latest state estimates available as of October 7, 2026 are for 2024, published in BEA’s February 19, 2026 release. Examples illustrate the spread: California’s all-items RPP was 110.7, Hawaii’s 110.0, and New Jersey’s 108.8; Arkansas’s was 86.9, Mississippi’s 87.0, and Iowa’s and Oklahoma’s were both 87.8. These figures are averages, not a ranking of where a particular household should move.
What’s actually slowing this PC down?
Pick the symptom - the matching free tool is one click away.
Compare the same year for both places. If you are choosing between particular cities, use BEA metro or local-area RPPs where available rather than assuming the state average describes either destination. The 2024 release discontinued the separate metro-area publication of real PCE and real personal income statistics; that does not mean the state and local RPP product itself has been discontinued.
#1 Best Overall

- EXTRA-LARGE FIXED DISPLAY: The 4-inch, extra-large LCD screen features a fixed display that displays crisp digits to prevent reading errors.
- DUAL POWER SOURCE: Operates on dual power (solar with battery backup) and requires 1 LR44 battery (included) to deliver continuous power for your business calculations.
- COST-SELL-MARGIN KEYS: Features dedicated cost-sell-margin keys that allow quick profit margin calculations, alongside a grand total key, double-zero key, and more.
- ACCURATE DATA ENTRY: Durable keys are comfortably spaced for accurate data entry, while a backspace key allows fast, simple corrections for time-saving use.
- TRUSTED BY WORKPLACES FOR DECADES: Sharp has been a dependable name in office calculation for generations — practical tools built around the way people actually work.
Read the index for what it measures—and what it does not
RPP is a weighted measure of average regional price levels for consumer goods and services. It is not a dollar estimate of your household’s budget, an affordability score, or a measure of inflation. An index of 90 does not mean your own bills will necessarily be 10% lower. Inflation measures price changes over time; RPP compares price levels across places for a given year.
BEA builds the estimates using federal data, including Bureau of Labor Statistics Consumer Price Index (CPI) data, Census American Community Survey housing data, and BEA personal consumption expenditures data. Its methodology combines price relatives and expenditure weights to estimate geographic price differences. Because the index uses broad categories and average prices, your household’s size, housing choice, commute, health needs, and lifestyle may produce a different spending mix. Read the BEA methodology and its additional information on the release for definitions and limitations.
Rank #2
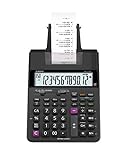
- FAST TWO-COLOR PRINTING – Prints at 2.0 lines per second with dual-color output (black/red) for easy distinction between positive and negative values.
- CHECK, CORRECT & RE-PRINT – Review and correct up to 150 steps before printing; use re-print and after-print functions for efficient documentation.
- TAX & BUSINESS FUNCTIONS – Includes cost/sell/margin, mark-up/mark-down, tax calculation keys, and currency exchange for quick financial operations.
- BIG DISPLAY & EASY INPUT – Features a 12-digit LCD and large, clearly spaced plastic keys for comfortable, accurate data entry.
- UPGRADED DESIGN – New version of the HR-100TM, ideal for taxes, bookkeeping, and accounting with clock/calendar printouts, subtotal & grand total, and percent functions.
BEA cautions that CPI was not designed for place-to-place comparisons, and sparse or uneven price samples can make some estimates volatile. For selected volatile CPI items—especially medical and education services—the methodology may replace extreme regional price levels with national price levels. Treat RPP as a consistent starting point, then verify the expenses that matter most to you with current local information.
Compare housing separately
Housing can dominate a household budget, and BEA says rent differences are often the main driver of differences in overall RPPs. In 2024, the housing-rent RPP was 154.3 in California and 54.2 in West Virginia. Those figures compare average rent price levels with the national level; they are not monthly rent amounts or quotes for a particular home.
Rank #3

- ENTER DIMENSIONS JUST LIKE YOU SAY THEM: Input measurements directly in feet, inches, building fractions, decimals, yards and meters, including square areas and cubic volumes; one key instantly converts your measurements into all standard Imperial or metric math dimensions that work best for you and the project you are working on
- DEDICATED BUILDING FUNCTION KEYS: Make determining your project needs easy; just input project measurements, select material type like wallpaper, paint or tile; then calculate the quantity needed and total costs to avoid surprises at the homecenter checkout
- ACCURATE MATERIAL ESTIMATION: Helps you estimate material quantities and costs for your projects, ensuring you never buy too much or too little material; simplifies your home improvement and decorating jobs and cuts down on the number of trips to the hardware store
- PRECISE PAINT CALCULATIONS: Calculate exactly how much paint you need to ensure you finish the job without finding yourself with a half-painted room at night with a wet paint roller, and avoid storing or disposing of excess paint
- 11 BUILT-IN TILE SIZES: Make it easy to estimate the quantity needed to complete your project; simply calculate your square footage, then determine the tile required based on tile size and compare tile usage and costs by size; comes complete with hard cover, easy-to-follow user's guide, long-life battery and 1-year warranty
For a useful comparison, identify the home type, size, and neighborhoods you would actually consider. Check current rents or likely ownership costs, availability, insurance, and property-related expenses. A statewide rent index can conceal large differences between urban, suburban, and rural areas, and an index cannot tell you whether a suitable home is available at your target price.
Build a destination budget around your household
Use the index to identify where broad price differences may matter, then replace the average basket with realistic estimates for your own recurring expenses. Compare the same categories for your current home and the destination:
Rank #4

- PRINTING CALCULATOR LOGIC: Operates on printing calculator logic instead of a standard desktop calculator, giving business users a familiar, streamlined way to process calculations.
- PAPERLESS SCROLLING DISPLAY: A 12-digit display works together with a 5-line scrolling LCD that stores up to 300 entries, keeping recent calculations organized without added paper waste.
- COST, SELL AND MARGIN KEYS: Dedicated cost, sell, and margin keys handle quick profit calculations, alongside decimal, rounding, percent, sign change, backspace, and grand total functions.
- COMPACT, PORTABLE BUILD: A cordless design and compact enclosure make it simple to move this calculator from one workspace to the next without searching for an outlet.
- TRUSTED BY WORKPLACES FOR DECADES: Sharp has been a dependable name in office calculation for generations — practical tools built around the way people actually work.
- Housing: rent or likely ownership costs for a comparable home, plus relevant insurance and property costs.
- Utilities: expected bills for the type and size of home you would occupy.
- Food: routine grocery and dining spending, adjusted for your household’s habits.
- Transportation: vehicle costs, transit, commute distance, and likely commute mode.
- Health care: expected medical spending based on your needs and coverage.
- Childcare or education: include these if they apply to your household.
- Other major recurring expenses: add any category that materially affects your monthly budget.
Use actual listings, local quotes, and your own spending history where possible. BEA’s explainer on comparing prices across the country describes separate goods and service categories, but its examples use 2022 data; use the current tables for current comparisons.
Quick wins for a faster PC:
Scan for outdated or missing drivers - takes under a minuteDriver Scan →Clear out junk files and repair common Windows errorsFree Scan →Compare take-home income, not just prices
A lower regional price level does not automatically make a move financially favorable. Estimate what you could realistically earn in the destination: do not assume your current salary will transfer unchanged unless your employer and work terms confirm it. Compare expected after-tax take-home pay and relevant benefits or deductions against the destination’s recurring budget.
Best Value

- WORKS IN UNITS THAT WORK FOR YOU -- enter dimensions directly in feet, inches, fractions, yards and meters including square and cubic formats and then instantly convert to any standard building unit you prefer for consistent solutions that makes sense to you
- SET A PROJECT’S MATERIAL REQUIREMENTS to define and use stored values for estimating, including custom tile size, grout gaps, board widths, fence post spacing, paint coverage and more so you can quickly determine your material requirements and costs
- BUILT-IN FUNCTION KEYS help you easily find the number of boards or posts based on standard board lengths and stored measurements, so you get the fencing or decking material quantities you need to finish the job without costly overages or underages
- FIGURE OUT FLOORING REQUIREMENTS with built-in standard carpet roll lengths, linoleum square and roll sizes, custom tile sizes with various grout widths to quickly calculate coverage area and square yards you need based on an entered or calculated floor area
- Works directly in yards, feet, inches, fractions and meters – including square and cubic formats. No need to convert to decimals.
BEA’s real personal income statistics are regional, price-adjusted measures—not a forecast of your earnings, personal tax calculation, or estimate of your paycheck. Use them as regional context, not a substitute for a job offer, tax estimate, or benefits comparison.
Keep moving expenses outside the monthly comparison
Moving costs are one-time transition expenses, not the recurring regional price level measured by RPP. Estimate them separately and obtain quotes for your route, moving date, and chosen service level. Depending on your move, include:
- Movers or a rental truck
- Travel to the destination
- Rental or utility deposits
- Storage
- Overlapping rent or mortgage costs
Make a side-by-side scenario
A simple comparison makes assumptions visible and helps separate recurring affordability from the cash needed to relocate. Use the same data date and comparable assumptions for each place; add low and high estimates where a cost is uncertain.
The Tool Desk
Outbyte Driver Updater FREEFix the driver behind crashes, sound loss and screen glitchesFind Drivers →Outbyte PC Repair FREERepair Windows errors before they cause bigger problemsFix Now →- Choose the locations and data year. Start with same-year state RPPs, then use metro or local-area comparisons when relevant and available.
- Record the benchmark. Note each all-items RPP and, where useful, relevant category indexes such as housing rents.
- Estimate your actual monthly costs. Price the home and recurring categories you expect to use in each location.
- Estimate destination take-home income. Use credible pay and account for taxes, benefits, and deductions separately from the price index.
- Total recurring costs and compare the monthly gap. Calculate how much remains from expected take-home pay after your estimated monthly spending.
- Add one-time relocation costs separately. Do not fold deposits, travel, or movers into a regional price comparison; show how those costs affect the cash required for the move.
- Write down dates and assumptions. Label the price data year and the dates of listings, quotes, income estimates, and tax assumptions so the comparison can be updated.
The BEA product page lists December 10, 2026 as the next scheduled release for state real PCE, real personal income, and RPP estimates. Until that release, the 2024 figures above are the latest state estimates identified here; check the BEA data page for updates when comparing locations.
Quick Recap
Product prices and availability are accurate as of the date/time indicated and are subject to change. Any price and availability information displayed on Amazon at the time of purchase will apply.

