Compare a flu forecast only with an observation that measures the same outcome, place, and time period. For CDC’s current FluSight hospital target, that means comparing a forecast of weekly influenza hospital admissions with the matching NHSN admissions data—not with outpatient flu-like illness, positive-test share, a FluSurv-NET rate, or a hospital’s current census. Then account for forecast lead time, data revisions, and uncertainty.
Start by identifying what the forecast predicts
“Flu activity” can refer to several different measures. CDC surveillance describes where, when, and what influenza viruses are circulating; it does not directly count every influenza illness. Forecasting estimates future activity to support planning. As CDC explains in U.S. Influenza Surveillance: Purpose and Methods (2025) and About Flu Forecasting (2024), these are related but distinct jobs.
As an Amazon Associate I earn from qualifying purchases.
FluSight’s hospital forecast target is weekly influenza hospital admissions reported through the National Healthcare Safety Network (NHSN). CDC’s 2025–2026 evaluation covered the current week and up to three weeks ahead for the United States, states, Puerto Rico, and Washington, D.C. Since the 2021–2022 season, CDC has based its flu hospitalization forecasts on NHSN data.
For NHSN, a new influenza admission is an inpatient admission with a positive flu test at admission or within the preceding 14 days, according to CDC’s U.S. Influenza Surveillance: Purpose and Methods (2025). It is not the same measure as the number of patients currently in beds, the number of people seeking outpatient care, or all infections in a community.
#1 Best Overall

- FDA Authorized 15-Minute Flu A&B, COVID Test Kit: Over-the-counter flu and COVID test for home use with rapid results in just 15 minutes.
- Made for Ages 2 and Above; Parents Can Stop Guessing: Quickly identify whether you or your kids are dealing with coronavirus or influenza A & B. Adult-collection is required for those aged 2-13 years, and self-collection by individuals aged 14 years and older.
- Same Ease-of-Use; Get 3 Results in 1 Test: Utilizing the familiar 4 user-friendly steps of at-home COVID tests, you can now get all 3 results for COVID-19 and Flu A & B at once with 5 drops of sample.
- Fast and Convenient COVID and Flu Tests for Home: Use this COVID and influenza rapid test kit in the comfort of your home. Bypass the need for a doctor's visit and protect your loved ones from potential exposure to contagious illnesses at school, work, or public gatherings.
- Compact Design for On-the-Go Testing: Stay safe wherever you go with our COVID-19, Flu A & B 3-in-1 self-test. Its compact design ensures easy storage and convenient portability for your travel bag.
Choose the observation that matches the target
| Observation | What it measures | Geography and appropriate use | What not to treat it as |
|---|---|---|---|
| NHSN hospital admissions | Weekly new influenza hospital admissions under the NHSN definition | FluView Interactive describes national and HHS-region series; state and jurisdiction target data are used in FluSight evaluation. Match a national forecast to the national series, or a state forecast to that state’s target. | Not outpatient ILI, test positivity, a hospitalization rate, or a single hospital’s census. Facility-level NHSN submissions do not mean every facility’s data are publicly exposed. |
| FluSurv-NET hospitalizations | Laboratory-confirmed influenza-associated hospitalizations among residents of defined surveillance areas, expressed as rates using the area population | A population-based lens for hospitalization rates and patient characteristics in its covered areas. CDC’s FluSurv-NET methods page describes coverage of more than 90 counties or county equivalents in 14 states, more than 34 million people, an estimated 10% of the U.S. population, and year-round collection beginning in 2025–2026. | Not an NHSN admission count or a complete national census. CDC cautions that FluSurv-NET results may not generalize to the whole country. |
| Outpatient influenza-like illness (ILI) | Visits meeting an influenza-like illness definition; ILI can be caused by viruses other than influenza | FluView Interactive offers national, regional, and select-state outpatient ILI data. Use it to compare a forecast for ILI or to understand outpatient activity, not to score a hospital-admission forecast. | Not laboratory-confirmed influenza admissions or a direct count of flu infections. |
| Laboratory data | Influenza testing results, including measures such as the share of tests positive | FluView Interactive provides national, regional, and select-state laboratory data. These can help describe viral activity when the forecast predicts a matching laboratory measure. | Not interchangeable with admission counts, ILI visits, or population hospitalization rates. |
| Local hospital or health-system data | Whatever the institution records: for example, new admissions, current inpatient census, or positive tests among its patients | Potentially useful for local operations if the facility or system has lawful access and can define the catchment, event, and time period. Compare only with a forecast built for a genuinely corresponding population or facility. | Not automatically equivalent to a state or national NHSN series; local testing, transfers, referral patterns, and catchment can change what the count represents. |
CDC’s FluView Interactive description presents these signals as complementary views of influenza activity, not different labels for a single outcome. Its public description does not establish a universal hospital-by-hospital NHSN dataset or a standard route for obtaining local facility data.
Align geography, dates, and forecast lead time
A forecast and observation can look mismatched even when both are accurate descriptions of their own data. Before comparing them, write down the place, target week, and forecast issue date. Keep the lead time attached to the result: a one-week-ahead prediction is not the same test as a three-week-ahead prediction.
Rank #2

- FDA Authorized 15-Minute Flu A&B, COVID Test Kit: Over-the-counter flu and COVID test for home use with rapid results in just 15 minutes.
- Made for Ages 2 and Above; Parents Can Stop Guessing: Quickly identify whether you or your kids are dealing with coronavirus or influenza A & B. Adult-collection is required for those aged 2-13 years, and self-collection by individuals aged 14 years and older.
- Same Ease-of-Use; Get 3 Results in 1 Test: Utilizing the familiar 4 user-friendly steps of at-home COVID tests, you can now get all 3 results for COVID-19 and Flu A & B at once with 5 drops of sample.
- Fast and Convenient COVID and Flu Tests for Home: Use this COVID and influenza rapid test kit in the comfort of your home. Bypass the need for a doctor's visit and protect your loved ones from potential exposure to contagious illnesses at school, work, or public gatherings.
- Compact Design for On-the-Go Testing: Stay safe wherever you go with our COVID-19, Flu A & B 3-in-1 self-test. Its compact design ensures easy storage and convenient portability for your travel bag.
- Geography: Pair national with national, state with the same state, and a local forecast only with an observation whose population or facility definition matches it. An HHS-region series, FluSurv-NET catchment, and hospital system are different geographic units.
- Event week: Most influenza surveillance uses Sunday–Saturday weeks. Long-term-care facility data are an exception and use Monday–Sunday weeks. Do not shift one series to fit another without documenting the change.
- Forecast vintage: Preserve the date the forecast was issued as well as the target week. The lead is determined by how far ahead the forecast was made, not by when someone later downloads it.
- Observation vintage: Record the download date and whether counts were preliminary or final. Recent surveillance data can arrive with delay and be revised, so a forecast should be judged against a clearly identified data vintage.
A chart caption should state the season, surveillance week, geography, target definition, forecast issue date or lead, and observation download date. Without these labels, readers cannot tell whether an apparent miss is a forecasting error or a mismatch in the comparison.
Compare uncertainty as well as the central estimate
A forecast’s median or central estimate is only one part of its prediction. If intervals are available, show them alongside the observation and assess whether they are both informative and calibrated: an interval that is very wide may contain the outcome often but offer little planning value, while a narrow interval can be useful only if it captures outcomes at the expected rate.
Rank #3

- 3-In-1 Flu A B And COVID-19 Test Kit: Designed to check for multiple respiratory targets in one test, allowing users to complete a single test instead of using separate kits at home.
- Simple At-Home Testing Process: Step-by-step format with nasal swab, buffer tube, and test cassette designed for straightforward use during everyday situations when testing is needed.
- Quick Results In About 10 Minutes: Provides results in a short timeframe, making it a convenient Covid home test to use before travel, or gatherings.
- Designed For Family Use Ages 2 And Up: Suitable for a wide range of users, including adults and children, making it a practical option for shared household use.
- Compact Single-Test Kit For On-Demand Use: The portable design on these covid tests allows for easy storage in a drawer, bag, or travel kit for quick access when needed.
CDC’s 2025–2026 FluSight evaluation primarily used relative weighted interval score (relative WIS). A relative WIS below 1 indicates better performance than the carry-forward baseline; lower is better relative to that baseline. CDC also reported prediction-interval coverage—the share of observed outcomes that fell inside forecast intervals. A model’s rank alone omits how it compared with the baseline and whether its uncertainty ranges were reliable.
Use the published baseline when evaluating FluSight results. For a local forecast without a directly comparable published baseline, define a simple local naïve baseline in advance—for example, a documented rule that carries forward the latest observed value—and apply it consistently. Do not choose a baseline after seeing which one makes a model look strongest.
Rank #4
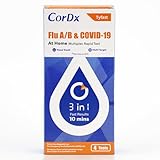
- 3-in-1 Multiplex Detection: Detects SARS-CoV-2, Influenza A, and Influenza B antigens from a single anterior nasal swab sample.
- Designed for Symptomatic Testing: Intended for individuals experiencing symptoms of respiratory infection within the first 5 days of symptom onset.
- Simple Nasal Swab Collection: Uses a short anterior nasal swab sample with step-by-step instructions included in the kit.
- Fast Results in 10 Minutes: Provides results in approximately 10 minutes when used according to the instructions for use.
- 10 minute accuracy —why wait 15? With our rapid testing kit, get peace of mind in 10 minutes and precise results without the extra wait. Proven higher PPA than major competitors, based on IFUs.
What CDC’s 2025–2026 evaluation shows—and does not show
In CDC’s FluSight 2025–2026 Evaluation (published September 30, 2026), the FluSight ensemble ranked seventh of 39 included models by average relative WIS across jurisdictions, excluding the national forecast. It was one of 12 models that consistently beat the baseline in all jurisdictions; 33 of the 39 evaluated models performed better than the carry-forward baseline.
Quick wins for a faster PC:
Fix the driver behind crashes, sound loss and screen glitchesFind Drivers →Repair Windows errors before they cause bigger problemsFix Now →That season’s results also show why an overall score is not a guarantee at turning points. For the ensemble’s two-week horizon across jurisdictions, fewer than one-quarter of prediction intervals contained the observed outcome in the week ending December 27, 2025, which coincided with the national and most common jurisdictional peak. Coverage stabilized near 95% starting in February 2026. Those figures describe that horizon and those periods, not whole-season coverage for every forecast or every model.
Best Value
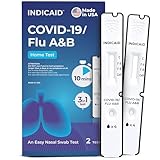
- Comprehensive 3-in-1 Test: The INDICAID COVID-flu test combo is a convenient way to detect COVID-19, Flu A, and Flu B. Everything you need is in this test home kit. It’s a must-have over-the-counter solution for anyone experiencing cold and flu symptoms.
- Fast, Reliable Results: This rapid influenza and COVID home test kit gives you 3 results in just 10 minutes, and it’s incredibly easy to use. All it requires is a shallow nasal swab, and the test can be completed in four simple steps. No more guessing!
- Trusted Technology: This flu and COVID test kit at home is FDA 510(k)-cleared, ensuring high-quality and accurate results. The combo test uses the same technology as COVID-19 rapid tests and can detect multiple COVID-19 and Flu A&B variants and strains.
- Versatile Use: The INDICAID COVID and flu test kit comes in a compact package, perfect for travel, school, work, and home. It’s also family-friendly. Individuals ages 14 and over can self-check, while children ages 2-14 require adult assistance.
- Extended Shelf Life: The shelf life of the INDICAID COVID-19/Flu A and Flu B Rapid Antigen Test has been extended to 16 months and is regularly extending. Simply scan the QR code on the box to find out the tests’ expiry date. Made in the USA.
CDC notes that ensemble forecasts have often been among the more accurate approaches in infectious-disease forecasting, but may miss rapid changes such as season onset or a peak. Its evaluation’s result belongs to the evaluated FluSight ensemble; it should not be attributed to every model described as “AI.” CDC groups submissions using teams’ method descriptions, with AI/machine learning among several methodology classes that also include statistical, mechanistic, and ensemble approaches.
A practical comparison workflow
- Write the target in plain language. Specify admissions, admission rates, ILI visits, test positivity, or another exact measure. Avoid the catch-all label “flu cases.”
- Select the matching observation. Use the same outcome definition and geography as the forecast. For a FluSight NHSN admission forecast, use the corresponding NHSN admission target—not FluSurv-NET rates, outpatient ILI, or local census.
- Fix the dates and horizon. Record the forecast issue date, event week, lead time, and week convention. Keep Sunday–Saturday and Monday–Sunday series distinct unless a documented transformation is necessary.
- Freeze the data vintage. Save the observation download date and note whether values are preliminary or final. If later revisions change the observation, report that revision rather than silently replacing the original comparison.
- Plot the distribution against the outcome. Show the central estimate and prediction intervals where supplied, together with the observed value. Evaluate both relative WIS or another suitable score and interval coverage; compare against a baseline.
- Break out place and epidemiologic phase. Report jurisdiction-level variation and examine onset, peak, and decline separately. A season-wide average can hide a sharp miss in the period when staffing or bed decisions mattered most.
- Judge usefulness for the decision. Ask whether the target and lead time support the intended action, such as bed planning, staffing, antiviral supply, or public messaging. A forecast can be directionally useful without being a reliable facility-level prediction.
How to handle a local hospital comparison
First determine whether the local number is a count of new admissions during a week, the number of current inpatients on a particular day, or a count of positive tests. These answer different questions. Then document the hospital or system’s catchment, transfers, testing practices, and any changes in reporting. A hospital can receive patients from outside its immediate community, and a change in who is tested can affect the observed series even when underlying flu activity has not changed in the same way.
Only compare a facility series with a forecast whose population and target definition align. A state-level forecast can provide context for a hospital, but it is not evidence that the model predicts that hospital’s workload. If no local forecast or matching observation is available, describe the comparison as contextual rather than as a local accuracy test.
What to include when reporting a result
- Season, forecast source and model or ensemble name, and target definition.
- Geography and population or facility represented by the observation.
- Forecast issue date, target week, and lead time.
- Observation source, download date, and preliminary or final status.
- Central estimate and intervals, plus the score, baseline, and interval coverage used.
- Any mismatch, revision, or local-data limitation that affects interpretation.
CDC’s 2025–2026 page says evaluation of FluSight’s emergency-department visit percentages due to flu is forthcoming. The performance figures above concern hospital admissions and should not be applied to that separate forecast target.
Quick Recap
Product prices and availability are accurate as of the date/time indicated and are subject to change. Any price and availability information displayed on Amazon at the time of purchase will apply.

