Choose the sampling rate from the fastest motion your tracker must preserve, not from a customary IMU setting. Identify the highest frequency that matters, sample comfortably above twice that frequency, and filter unwanted energy before the ADC or before any digital decimation. Nyquist’s limit is a mathematical minimum; real filters have transition bands, sensors add delay, and tracking systems must keep samples time-aligned with cameras, encoders, and control loops.
There is no universal “best” rate or low-pass cutoff. A slow human-posture tracker, a vibration-monitoring accelerometer, and a high-speed robotic controller need different bandwidths. The method below lets you derive settings from the motion, then verify that the sensor’s own bandwidth, filters, output-data-rate settings, and timestamps support them.
As an Amazon Associate I earn from qualifying purchases.
Start with the motion you need to measure
Write down the physical event that the estimate must resolve. It might be a person’s limb movement, a machine vibration, a short impact, or the phase relationship between an IMU and a camera. Convert that requirement into the highest frequency content that must survive processing.
Periodic motion
For a roughly periodic movement, the fundamental frequency is only the starting point. A non-sinusoidal movement contains harmonics. A sharp acceleration peak, for example, needs more bandwidth than a smooth sinusoid at the same repetition rate. If the tracker must reproduce the shape of the movement rather than merely detect its repetition, include the highest harmonic that affects the estimate.
#1 Best Overall

- High performance Rd-03D 24G radar sensor module with multi-target human motion trajectory localization and tracking, featuring 8m detection range and 0.75m distance resolution for precise target positioning and tracking
- Easily integrate the radar module into various applications such as smart homes, smart businesses, bathrooms, and smart lighting, thanks to its compact size of 15*44mm and the convenience of automatic default configuration loading
- Support 24GHz ISM frequency band and provide accurate detection with a detection range of ±60° azimuth angle and ±30° elevation angle, making it ideal for smart home, smart business, bathroom, and smart lighting applications
- Onboard PCB antenna and high-performance microstrip antenna for high detection accuracy and the ability to support UART for smart radar tuning via serial communication, providing quick and convenient operation
- The radar module comes with a 5V single power supply and offers a visual tool for configuring tracking detection range, data reporting interval, and target retention time, ensuring a seamless and efficient user experience
Short events and changes
Impacts, foot strikes, tool contact, and abrupt direction changes are broadband events. A single “motion frequency” may not describe them well. Estimate the shortest feature duration that must be represented and validate the estimate with representative data. A rate that is adequate for a smooth trajectory can smear or miss a brief event.
Do not target the sensor’s maximum bandwidth automatically
Use only the bandwidth required by the application. Accepting every frequency the sensor can produce increases data volume and often admits vibration and electronic noise that make position or orientation estimates less stable. Conversely, setting the cutoff below a real movement removes information that cannot be recovered later.
How sampling rate follows from bandwidth
For a band-limited signal whose highest frequency of interest is fmax, the theoretical requirement is:
The Tool Desk
Outbyte Driver Updater FREEScan for outdated or missing drivers - takes under a minuteDriver Scan →Outbyte PC Repair FREEClear out junk files and repair common Windows errorsFree Scan →fs > 2 × fmax
This is the Nyquist condition. At exactly two samples per cycle there is no practical margin, and a real signal is not perfectly band-limited. A physical anti-alias filter rolls off gradually, so frequencies in its transition band also need to be considered. National Instruments explains that the sampling rate must exceed twice the highest frequency present in the transition region, not merely twice the nominal passband edge.
National Instruments also notes that sampling at about five times the signal frequency is often desired for practical waveform acquisition. That is general acquisition guidance, not a universal prescription for every motion tracker. The right margin depends on waveform shape, filter order, allowable amplitude and phase error, timing jitter, and processing requirements.
| Design point | What it means | When it is useful |
|---|---|---|
| Just above 2× the required bandwidth | Mathematically sufficient only for an ideal, perfectly band-limited signal | Rarely a safe production setting |
| Several times the required bandwidth | Leaves room for a real filter’s transition band and gives more samples per waveform | Most general motion-tracking designs |
| Very high oversampling | Preserves more detail and simplifies filtering, but raises data, power, and processing costs | Fast impacts, high-bandwidth control, or later offline analysis |
For example, if the application must preserve content through 20 Hz, 40 Hz is only the theoretical boundary. A rate such as 100 Hz may provide more useful waveform representation, but it is not automatically correct: the filter response, sensor output mode, and timing still have to be checked.
A practical sampling-rate selection workflow
- Define the estimate. State whether you need position, velocity, orientation, acceleration peaks, vibration amplitude, or cross-sensor timing. Different outputs can require different bandwidths.
- Find the highest frequency that matters. Use the fastest periodic component, the highest required harmonic, or the shortest event feature. Do not substitute the sensor’s advertised maximum bandwidth.
- Choose a rate above 2× that frequency. Add headroom for the filter transition band and the waveform fidelity you need. A higher rate is generally easier to filter, but increases power, storage, communication, and CPU load.
- Specify the retained passband and rejection band. Write down the frequency range to preserve and the range that must be strongly attenuated. This makes the transition-band requirement explicit.
- Filter before sampling or rate reduction. An analog input needs an anti-alias low-pass filter before the ADC. A digital-output IMU needs an internal-filter and output-data-rate configuration that suppresses energy above the new Nyquist limit before decimation.
- Check sensor documentation. Confirm bandwidth, passband ripple, attenuation, group delay or phase behavior, selectable filter modes, output data rate, timestamp behavior, and whether changing the output rate changes the internal filter.
- Verify with representative motion. Record the fastest and noisiest expected operating conditions. Inspect spectra, time-domain peaks, timestamps, and cross-sensor alignment before committing to the setting.
Anti-alias filtering: what must happen before sampling
Aliasing occurs when energy above the sampled system’s usable band appears as a false lower-frequency component. Once that energy has folded into the sampled data, no digital post-processing can reliably identify and remove it because the original and aliased frequencies are indistinguishable.
Quick wins for a faster PC:
Fix the driver behind crashes, sound loss and screen glitchesFind Drivers →Repair Windows errors before they cause bigger problemsFix Now →Scan for outdated or missing drivers - takes under a minuteDriver Scan →Analog sensors and ADCs
For an analog accelerometer, gyroscope, or position sensor, place a low-pass anti-alias filter ahead of the ADC. National Instruments describes this filter as passing low frequencies while attenuating high frequencies before the sampler and ADC. Its cutoff cannot be treated as an infinitely sharp boundary: the filter needs a transition region between the frequencies you retain and the frequencies you reject.
Rank #2

- Elevate your indoor spaces with our 24G millimeter-wave radar sensor, the LD2450. Designed for precision human motion Detection,effortlessly outputting distance, angle, and velocity data for moving targets via serial ASCII. Perfect for domestic, office, and hotel settings where smart, practical solutions are valued
- Boasting a wide detection angle (Azimuth: ±60° / Elevation: ±35°) and high angle precision (2°~20°), the 24G HLK-LD2450 radar sensor module stands out for its reliability and accuracy. Its advanced sensing capabilities make it an indispensable asset for creating smarter and safer indoor environments
- Engineered for excellence, our Radar Sensor Module operates at a frequency of 24G-42.25Hz, ensuring optimal performance through serial ASCII output. This smart sensing solution is designed to adapt to various indoor conditions without being affected by temperature, brightness, humidity, or light fluctuations, reinforcing its practicality in any setting
- Featuring an easy-to-install wall-mounted design, the LD2450 Sensing Distance radar offers up to 8m of precise tracking distance. Its exceptional adaptability makes it suitable for installation within various enclosures, providing they possess good transmission properties at the 24GHz
- Discover unparalleled performance with our 24G radar sensor. Whether it's for residential, commercial, or hospitality applications, this radar sensor module ensures accurate, reliable, and intelligent monitoring of movements within any indoor environment, showcasng its versatility and efficiency in real-time target tracking
Suppose the application retains 0–20 Hz and the ADC samples at 100 Hz. The new Nyquist frequency is 50 Hz. The filter should pass the required 0–20 Hz band with acceptable amplitude and phase error, then provide substantial attenuation before energy approaches 50 Hz. A cutoff set near 20 Hz does not by itself guarantee adequate rejection; the filter’s order and response determine how much attenuation is achieved by 50 Hz.
Digital-output IMUs
A digital IMU has already sampled its sensing elements internally, but that does not make aliasing irrelevant. Internal analog filtering, converter sampling, digital filtering, and output-data-rate selection form a chain. If unwanted vibration is not attenuated before an internal sampling or decimation stage, it can fold into the output band.
Analog Devices discusses aliasing in digital MEMS accelerometers and emphasizes checking the device’s internal filtering and output-rate configuration. Read the data sheet for the bandwidth associated with each output mode; do not assume that selecting a lower output rate alone provides the needed anti-alias protection.
Recommended Free Tools
Choosing a low-pass cutoff
Set the cutoff high enough to preserve the fastest movement that affects the estimate and low enough to attenuate irrelevant noise and vibration. The cutoff is therefore a compromise among motion fidelity, alias rejection, noise, delay, and phase behavior.
Passband and transition band
Define three quantities rather than one:
- Passband edge: the highest frequency whose amplitude and timing must remain within your error budget.
- Stopband start: the frequency above which strong attenuation is required.
- Allowed transition width: the interval in which the filter rolls off from acceptable transmission to required rejection.
A narrow transition band generally requires a higher-order or longer digital filter, which can add computation and delay. A wider transition band may allow a simpler filter, but it usually requires a higher sample rate if the same passband must be preserved.
Noise versus real motion
Lowering the cutoff can make an orientation or position estimate look smoother, but smoothness is not proof of accuracy. If the cutoff removes a genuine movement, the resulting signal has less lag only in appearance; the estimator is now acting on incomplete information. Raise the cutoff or sample faster when peaks, impacts, or rapid reversals are part of the task.
Delay and phase
Every causal filter introduces timing effects. Group delay matters when a controller reacts to the sensor, when a foot-strike event must be time-stamped, or when IMU data are fused with camera frames. Compare the filter’s delay across the retained band and document whether the output is time-stamped at measurement time, filter-output time, or another device-defined point.
What’s actually slowing this PC down?
Pick the symptom - the matching free tool is one click away.
Decimation and output-data-rate settings
Decimation reduces the number of output samples by keeping one sample out of a sequence or by averaging/filtering blocks. It must be preceded by a low-pass response that removes frequencies above the new Nyquist limit. Otherwise, those frequencies fold into the retained band during rate reduction.
Rank #3
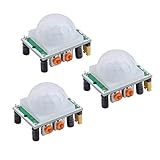
- Operating voltage range: DC 4.5-20V
- Quiescent Current: <50uA Trigger: L can not be repeated trigger/H can be repeated trigger(Default repeated trigger)
- Delay time: 5-200S(adjustable) the range is (0.xx second to tens of second)
- Board Dimensions: 32mm*24mm
- Angle Sensor: <100 ° cone angle Lens size sensor:Diameter:23mm(Default)
Analog Devices distinguishes a finite impulse response (FIR) decimation filter from a Kalman filter. An FIR decimator narrows the bandwidth and lowers the data rate; a Kalman filter estimates states from a model and measurements. They are not interchangeable. Use the FIR or other anti-alias stage to control bandwidth, then use a Kalman estimator if the application also needs model-based state estimation.
Device-specific example: ADIS16576
Analog Devices gives an example for the ADIS16576 in which a Bartlett FIR filter with 64 taps per stage reduces the cutoff to approximately 20 Hz, while averaging 80 sequential samples for each update produces a 50 Hz output data rate. Those values describe that sensor and configuration, not a general recommendation. Verify the current device documentation, the exact filter mode, and the resulting delay before using the example in a design.
What to confirm before lowering an IMU’s rate
- Which internal stage performs anti-alias filtering.
- The passband, stopband attenuation, and transition band for the selected mode.
- Whether the stated output rate is an update rate, an averaged rate, or a decimated rate.
- How many internal samples contribute to each reported sample.
- Filter group delay and the timestamp convention.
- Whether changing one setting automatically changes another.
Sampling, processing, and synchronization are one timing problem
A sensor may capture data at a high internal rate while the host reads it in a slower or asynchronous loop. The host’s loop rate is not the sensor’s sampling rate, and a high sensor rate does not guarantee coherent fusion with another device.
Use hardware timing information
Prefer a sensor data-ready signal, hardware trigger, or device-generated timestamp over the time at which a software thread happens to read a packet. Record the sensor clock, host clock, and any conversion between them. Buffering and USB or wireless transport can add variable delivery delay even when the measurement interval is perfectly regular.
Align multiple sensors
For camera-IMU or encoder-IMU fusion, determine whether timestamps refer to exposure, sample acquisition, filter output, or packet transmission. Measure or obtain the clock offset and drift. If one stream is resampled to another rate, apply an explicit interpolation policy and account for the filter delay rather than silently pairing the nearest received samples.
Asynchronous control loops
Analog Devices’ discussion of MEMS IMU data coherence highlights the gap that can exist between sensor capture and slower or asynchronous processing loops. Design the acquisition buffer and estimator around measurement time, not merely around when the software callback runs.
Sampling and filtering trade-offs
| Decision axis | Increasing rate or widening bandwidth | Reducing rate or narrowing bandwidth |
|---|---|---|
| Motion preserved | Retains faster movement and sharper events | May remove real motion above the cutoff |
| Aliasing risk | Moves the Nyquist limit upward, easing filter requirements | Requires stronger pre-sampling or pre-decimation rejection |
| Noise | Admits more high-frequency noise unless filtered | Can reduce irrelevant noise and vibration |
| Delay and phase | May permit a shorter filter for the same transition width | Longer or steeper filters can add delay and phase distortion |
| Data and processing load | Uses more bandwidth, storage, power, and CPU | Reduces output volume after proper filtering |
| Synchronization | Provides more timing granularity but still needs timestamps | Can complicate event timing and cross-sensor alignment |
Analog Devices’ vibration-monitoring material also points out that finite filters cannot provide unlimited rejection. A design that depends on extreme attenuation should increase the sample rate, improve the analog front end, or narrow the input bandwidth before conversion rather than assuming a practical filter behaves like an ideal brick wall.
Free tools Windows power users keep installed
One-click scans. No signup required.
Worked design examples
Example 1: posture and gesture tracking
Assume the application needs smooth human limb motion through 8 Hz and does not need impacts. A theoretical minimum is above 16 samples per second. In practice, choose a substantially higher rate so the passband and transition band fit comfortably below Nyquist, then select a low-pass cutoff above 8 Hz but below the frequency where sensor noise becomes objectionable. Validate that the filter does not delay the gesture enough to harm camera fusion or interaction feedback.
Rank #4
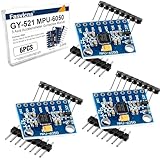
- 6-Axis Motion Tracking Sensor: The MPU-6050 IMU module integrates a 3-axis accelerometer and 3-axis gyroscope, enabling precise motion tracking, orientation detection, and angle measurement for a wide range of applications.
- I2C Interface for Easy Connection: Built with a standard I2C communication interface, requiring only SDA and SCL pins, making it simple to connect with microcontrollers and ideal for beginners and fast prototyping.
- High Sensitivity & Stable Performance: Provides reliable and accurate data output with high sensitivity, suitable for applications such as self-balancing robots, drones, gesture control, and motion sensing systems.
- Complete Kit with Jumper Wires: Comes with male-to-female and female-to-female jumper wires, allowing quick setup without additional purchases—perfect for breadboard experiments and DIY electronics projects.
- Wide Compatibility for DIY & Development: Fully compatible with Arduino, Raspberry Pi, ESP32, STM32 and other microcontrollers, widely used in robotics, IoT projects, education, and embedded system development.
Example 2: a 20 Hz machine vibration component
If amplitude and phase through 20 Hz matter, a 40 Hz sample rate is only the boundary. A 100 Hz or higher rate may make the anti-alias transition easier, provided the sensor and ADC actually support that bandwidth. Set the low-pass response to preserve 20 Hz, specify the attenuation required near the 50 Hz Nyquist limit, and inspect the measured spectrum for vibration above the intended band.
Example 3: a short impact
If the event contains a sharp feature, do not infer the rate from its repetition frequency. Capture at a higher rate, apply a filter whose delay and attenuation are known, and inspect the event in the time domain. If the production system later decimates, perform and verify anti-alias filtering before that reduction.
How to validate a configuration
- Test the quiet condition. Check the noise floor, spectral peaks, bias stability, and timestamp regularity while the sensor is stationary.
- Test the fastest expected motion. Repeat the real movement, vibration, or impact at its maximum operating condition. Confirm that peaks are not clipped or rounded beyond the error budget.
- Inspect the spectrum before and after filtering. Look for energy near the original and new Nyquist frequencies and for unexpected low-frequency products that could indicate aliasing.
- Measure filter delay. Apply a known transition or pulse and compare input and output timing. Record whether the delay is constant over the passband.
- Check rate changes. If the device offers several output data rates, verify each mode independently; filter bandwidth and latency may change with the rate.
- Check cross-sensor alignment. Compare hardware timestamps or synchronized events from the IMU, camera, encoder, and host. Quantify offset, jitter, and drift.
- Repeat after deployment changes. A firmware update, a different sensor mode, a new host driver, or a changed buffer size can alter timing or filtering behavior.
These are engineering validation steps, not a substitute for the sensor manufacturer’s specifications. The available sources do not report an independent laboratory benchmark for a universal motion-tracking setting.
Windows Errors? Fix Them Before They Spread
Repair common Windows errors and clear accumulated junk for a smoother, more stable PC - no reinstall needed.Free scan · no reinstallCrashes, No Sound, or Screen Glitches?
Random freezes, missing sound and display glitches usually trace back to one bad driver. Find and replace yours safely.Free scan · under a minuteTroubleshooting common failures
The output contains a false slow oscillation
Suspect aliasing from vibration or electrical noise above the sampled band. Check the input spectrum, lower the analog bandwidth before the ADC, raise the sample rate, or enable the documented internal anti-alias mode before decimation. Filtering the already sampled result may hide the symptom but cannot reliably reconstruct the original signal.
The signal looks smooth but events are late
Check group delay, block averaging, and buffering. A long FIR, moving average, or internal decimator may time-stamp data at the wrong point for your fusion algorithm. Compensate using the documented delay or choose a lower-latency mode if the application permits.
Lowering the output rate makes the estimate noisier
Confirm that the device changed its internal filter as expected. If output samples were dropped without a suitable low-pass stage, aliasing may have folded high-frequency noise into the band. Also check whether the estimator’s process and measurement-noise parameters were tuned for the former rate.
IMU and camera events do not line up
Do not align packets by host arrival time. Compare acquisition timestamps, account for exposure time and sensor-filter delay, and measure clock offset and drift. Ensure that interpolation or resampling does not introduce an unrecorded phase shift.
Changing the cutoff removes useful movement
Return to the application’s fastest required event and review the passband. Increase the cutoff or sample rate until that motion is preserved, then use the stopband and transition-band requirements to control noise instead of applying an unnecessarily low cutoff.
What to record in a design specification
- Required motion bandwidth and the physical events included.
- Chosen sample rate and the reason it exceeds the Nyquist boundary.
- Analog anti-alias filter type, cutoff, order, and expected attenuation, when an analog input is used.
- IMU internal filter, output data rate, decimation or averaging factor, passband, stopband, and delay.
- Timestamp source, data-ready behavior, clock relationship, and synchronization method.
- Permitted amplitude error, phase error, latency, jitter, and noise level.
- Validation motions, spectra, acceptance limits, and firmware or configuration version.
Keeping these details together prevents a common mistake: treating sample rate, bandwidth, filter cutoff, output rate, and host loop rate as if they were the same setting. They are related, but each describes a different part of the signal chain.
Quick Recap
Product prices and availability are accurate as of the date/time indicated and are subject to change. Any price and availability information displayed on Amazon at the time of purchase will apply.

