Do these 3 things before closing this tab:
1Repair Windows errors before they cause bigger problems2Scan for outdated or missing drivers - takes under a minute3Clear out junk files and repair common Windows errorsA reservoir gauge measures the height of the water, not how many gallons or acre-feet are stored. Operators estimate storage by matching that elevation to a reservoir-specific capacity table. A low reading means less water is held in reserve, but it does not by itself show whether a town, farm, or ecosystem will face a shortage: that depends on inflows, releases, operating rules, water rights, demand, and other available supplies.
How reservoir levels are measured
A gauge or other observing system records the water-surface elevation, typically in feet or metres relative to a vertical datum. That elevation is not the reservoir’s volume. Agencies use surveyed relationships between elevation, surface area, and capacity to estimate how much water is stored at a given level. The Bureau of Reclamation describes an area-and-capacity table as linked tabulations of area and capacity by elevation (Reclamation’s reservoir survey and capacity guidance).
As an Amazon Associate I earn from qualifying purchases.
Those relationships are specific to each reservoir. They are developed from topographic and underwater, or bathymetric, surveys. As sediment accumulates, the basin’s area and storage capacity can change, so a table may need updating.
Outdated Drivers Are Slowing You Down
One free scan finds every outdated or missing driver and matches the right update for your exact hardware.Free scan · exact hardware matchWindows Errors? Fix Them Before They Spread
Repair common Windows errors and clear accumulated junk for a smoother, more stable PC - no reinstall needed.Free scan · no reinstallLake Powell shows why surveys matter
The U.S. Geological Survey and Reclamation conducted topobathymetric surveys at Lake Powell beginning in 2017. The resulting elevation-area-capacity relationships, based on the spring 2018 survey, provide area and volume values at 0.33-foot increments across the surveyed elevation range. The USGS analysis estimated that Lake Powell’s capacity had decreased by 6.79 percent—1,833,000 acre-feet—from 1963 to 2018. That is a finding for Lake Powell, not a general rate for reservoirs (USGS Lake Powell capacity study).
#1 Best Overall

- TANK GAUGE: Always know how much water is in your tank with this easy-to-read, tank-top tank gauge
- KNOW YOUR WATER LEVEL: The easy-to-read dial features Empty and Full indicators to reveal at a glance how much water you currently have
- EASY TO INSTALL: A single hole in the tank is all that's required for installation, then a simple adjustment of the hands on the dial will calibrate it perfectly for your tank height
- SUITS MOST TANKS: The Tank Gauge is suitable for all vented aboveground and below ground tanks up to 8 feet in height
- EFFECTIVE WATER MANAGEMENT: Monitor your rainwater collection system efficiently with clear visual indicators that help you track water usage and plan refills accordingly
What a reservoir percentage means
A statement such as “20% full” is incomplete unless it identifies the denominator and the date. A percentage of live capacity, a percentage of total capacity, and a percentage of historical average describe different comparisons; they are not interchangeable. “Live capacity” generally refers to storage available for active use under the stated operating basis, while a historical-average percentage compares storage with a reference period’s typical level.
Agency dashboards can also report several measures together. Reclamation’s Upper Colorado Basin status map includes storage, pool elevation, inflow, and release information, while its Lake Powell operations page provides dated status and projections. Read the figure alongside the agency’s stated basis and observation date, not as a timeless description (Upper Colorado Basin reservoir status; Lake Powell current conditions and projections).
Rank #2

- Monitors water level of any storage system
- Easy-to-read dial face with empty and full indicators
- Quick and easy to install, suitable for all new and existing tanks
- Can be calibrated for holding systems up to 8' deep
Recent figures illustrate the difference
On the Reclamation Upper Colorado Basin map updated September 27, 2026, Lake Powell was listed at 22% of capacity and Blue Mesa at 17%. Those are dated snapshots; the map’s figures can change.
Quick wins for a faster PC:
Fix the driver behind crashes, sound loss and screen glitchesFind Drivers →Repair Windows errors before they cause bigger problemsFix Now →Scan for outdated or missing drivers - takes under a minuteDriver Scan →Reclamation reported Lake Powell’s end-of-August 2026 water-surface elevation as 3,517.87 feet and storage as 5.14 million acre-feet, or 22% of live capacity. The elevation and volume are complementary measures, and the live-capacity denominator matters when interpreting the percentage (Reclamation Lake Powell status).
Rank #3
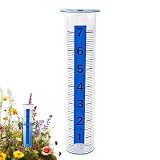
- Durable Outdoor Design: The rain gauge outdoor features anti-deformation properties and weather-resistant materials, ensuring reliable performance in garden or farm monitoring while withstanding harsh conditions for consistent use in any outdoor setting
- Enhanced Rainfall Tracking: With its high contrast scale markings and color printed enhancements, this rain gauge ensures low light visibility while simplifying rainfall data recording, offering reliable performance for homeowners managing irrigation schedules during cloudy or low-light days
- Night Visibility Feature: The water gauge for rain includes a light absorbing coating that enables glow in the dark functionality, ensuring clear visibility of the night visible water level without requiring external light sources; this 24 hour rainfall monitoring tool is ideal for tracking precipitation even during low-light conditions, enhancing convenience for gardeners and weather enthusiasts alike
- Reliable Water Collection System: Equipped with a funnel shaped rain collector and anti splash baffle, this rain gauge for yard ensures efficient rain water collection and reduces evaporation loss, providing accurate rainfall measurement for monitoring outdoor conditions effectively
- Flexible Installation Design: Featuring ground or wall mount capabilities, this rain gauge tube serves as a reliable gardening rainfall tool. Used in outdoor garden weather stations, it functions as meteorological observation equipment, aiding teaching experiments by offering accurate data collection in diverse settings with optimal stability
A different kind of comparison appeared on California Water Watch: estimated statewide reservoir storage was 13.6 million acre-feet as of October 4, 2026, equal to 68% of historical average. That is a statewide estimate measured against historical average—not the percentage of capacity of an individual reservoir (California Water Watch reservoir conditions).
What low reservoir levels mean for water supplies
Low storage reduces the reserve available to supplement rivers and deliveries when inflows are weak. It can put more pressure on decisions among authorized uses, but the same percentage can have different consequences at different reservoirs. A reservoir’s purpose, users, rules, water rights, alternative supplies, expected inflows, and planned releases all affect what a low level means locally.
Rank #4

- Rainfall monitoring and programmable alarms---This wireless digital rain gauge allows you to keep updated on the precipitation outside your home. By tracking the rainfall, you will always know the best time to water. Programmable rain alarm also can help you identify flood conditions. Allowing you to predict potential dangerous driving conditions or floods.
- Self-Emptying Rain gauge for Maintenance-free operation---The wireless rain gauge outdoor is self-emptying and easy to install, simply connect outdoor sensor with Indoor host and then start measuring Rainfall data automatically.
- Visual Reading digital rain gauge---This precise digital rain gauges outdoors best rated provides 8 different rainfall measurement: now,1hour,24hours,today,7days,month,year and total. Numeric measurements are monitored on a digital indoor display console and include historical data and cylindrical rainfall graph. It provides visual readout of temperature and rainfall.
- Multi Function Rain Gauge weather station---In addition to rainfall monitoring, this digital rain gauge can also provide real-time indoor and outdoor temperatures, WWVB Radio control time function. What’s more, dual alarm clock with snooze function and calendar is practical in your usual life. Functional and stylish, JMBay rain gauge weather station is the perfect decoration for your living room, bedroom, office, greenhouse, tent, and more.
- Blue Backlight For Easy Nighttime Viewing---By pressing the ''Light'' button above the screen of digital rain gauge, you can turn on the soft, blue backlight and it will stay on for 15 seconds, it’s perfect for checking the temperature, time and rainfall at night.If the weather station with rain gauge outdoor does not meet your expectation or any problem with the product, please contact us immediately.
For example, Reclamation’s April 16, 2026 update said most reservoirs along the Rio Chama and Rio Grande held less than 15% of capacity, leaving little stored water to supplement river flows for irrigation, municipalities, recreation, and endangered species. The reported figures included Heron at 11%, El Vado at 13%, and Elephant Butte at 13%. These conditions show how low storage can constrain a system; they do not establish a universal threshold for restrictions (Reclamation Rio Grande and Pecos update).
How to assess whether a low level affects your area
For a particular water customer or irrigation district, a headline percentage is only a starting point. Check the local water provider’s supply notices and allocation information, the reservoir operator’s status and release forecast, and applicable drought or emergency rules.
Best Value

- True Water Level Reading
- Confirm the measure: identify whether the figure is volume, elevation, percent of live capacity, percent of total capacity, or percent of historical average.
- Check the date: reservoir conditions and agency projections change; use the observation date shown with the figure.
- Look beyond storage: review inflows, releases, forecasts, and relevant operating thresholds along with the stored volume.
- Connect the reservoir to your supply: determine whether your provider draws from it and what other sources, allocations, or rules apply.
In Texas, for instance, precise elevation observations can be matched with Texas Water Development Board capacity tables to calculate storage. The USGS and Texas Water Development Board explain how to find daily status and historical elevation observations in their reservoir and lake reporting FAQ.
Why reservoir comparisons need context
Two percentages are not directly comparable just because both are labelled “full.” When comparing reservoirs or reports, establish what each number measures and how the systems operate.
- Compare absolute storage volumes using the same units.
- Identify each percentage’s denominator and the date of observation.
- Check elevation datum and any relevant operating thresholds.
- Review inflows, releases, and forecasts, not just the current stored amount.
- Account for the reservoirs’ authorized purposes, legal allocations, and the communities or ecosystems they serve.
Capacity tables also have a time dimension: sediment can change the relationship between elevation and stored volume. A reported percentage therefore depends both on the current water level and on the capacity basis used to calculate it.
Recommended Free Tools
Quick Recap
Product prices and availability are accurate as of the date/time indicated and are subject to change. Any price and availability information displayed on Amazon at the time of purchase will apply.

