Outdated Drivers Are Slowing You Down
One free scan finds every outdated or missing driver and matches the right update for your exact hardware.Free scan · exact hardware matchWindows Errors? Fix Them Before They Spread
Repair common Windows errors and clear accumulated junk for a smoother, more stable PC - no reinstall needed.Free scan · no reinstallDesmond Kangah’s LSU civil engineering work uses Sentinel-1 radar satellite data to measure slow ground sinking in East Baton Rouge Parish, Louisiana, then applies machine learning to show where that movement concentrates, which conditions appear to be associated with it, and how it may evolve through 2030. A companion study with co-authors Ahmed Abdalla and Abdelrahim Salih applies a related satellite method to local transportation assets. Together, the two studies can point to road and bridge locations where surface movement and modeled susceptibility are elevated. They cannot diagnose a specific structure, and they do not replace site inspection or engineering judgment.
Why ground movement matters for roads and bridges
Land subsidence is downward movement of the ground surface, often a few millimeters per year rather than a sudden event. The engineering concern is differential movement: when one section of ground settles faster than its neighbors, pavement, embankments, and bridge approaches can be stressed unevenly. A map that highlights where movement is faster than its surroundings is a screening tool. It tells engineers where a closer look may be warranted, not what condition a given structure is in.
As an Amazon Associate I earn from qualifying purchases.
How satellite radar measures ground movement
Interferometric synthetic aperture radar (InSAR) compares radar images of the same area collected at different times. Small changes in the distance between the satellite and the ground, measured along the satellite’s line of sight, reveal surface movement. A single pair of images gives one snapshot of change. Many observations over years produce a time series, which is what allows analysts to separate steady movement from noise and seasonal fluctuation.
Free tools Windows power users keep installed
One-click scans. No signup required.
Kangah’s thesis uses Sentinel-1 radar observations and reports 246 ascending-track acquisitions. The transportation study uses a different InSAR variant. Both are described below.
#1 Best Overall

- 7 Measurement Modes: Measure area, distance, height and slope; save coordinates (save only, no edit). Two area measurement methods for gardens, parking lots, ranches and flat lands; two distance modes for paths, boundaries and irregular routes to measure straight and curved distances
- Sunlight-Readable 3.2 Inch Color Screen: 240×320 high-resolution large display. Measurement results show directly on screen for easy viewing, clearly visible even under direct bright sunlight
- High Precision Measuring: Supports 6 satellite systems for fast, reliable signal, area measurement error in 0.002 acres, distance error in 5 ft, it cannot search satellite signals indoor
- Durable Design: Built-in 4000mAh rechargeable battery supports up to 48 hours of land measuring operation; Rugged IP65-rated design works reliably in all environments
- Important Usage Instructions: Search satellite signals in an uncovered sky before using. When the signal value in the upper left corner of the device screen is below 1 m, start using to ensure the accuracy of the device. This device does not have map and cannot be used for navigation
Two InSAR methods, two different jobs
The two studies use related but distinct processing approaches, and they answer different questions.
| Feature | Kangah LSU thesis (Spring 2026) | Transportation paper (IEEE JSTARS, 2026) |
|---|---|---|
| InSAR method | Small Baseline Subset (SBAS) InSAR | Persistent-scatterer InSAR (PSI) |
| Satellite data | Sentinel-1 radar observations; 246 ascending-track acquisitions | Sentinel-1 persistent-scatterer interferometry |
| Modeling layer | Ensemble machine learning (Extra Trees, Random Forest), a physics-constrained LSTM network, and explainable AI | Random Forest and SHAP (SHapley Additive exPlanations) |
| Geographic focus | East Baton Rouge Parish, Louisiana; subsidence susceptibility and temporal forecasting | East Baton Rouge Parish, Louisiana; local transportation infrastructure stability |
| Main question | Where subsidence concentrates, what conditions are associated with it, and how it may evolve | Which transport assets show localized deformation, and which factors dominate the pattern |
| Independent ground check | Not stated in the repository record | GNSS reference-station observations used to compare against the InSAR time series |
The EGU26 abstract by Kangah and Abdalla describes the SBAS time-series window as 2017 to 2025 and frames the forecasts as carrying quantified uncertainty. That abstract does not give the thesis’s specific forecast values, so those values in this article come only from the thesis.
The four-stage workflow: measurement, interpretation, forecast, follow-up
Kangah’s approach can be read as four stages. Each stage produces a different kind of output, and each has a different ceiling on what it can tell a reader.
Recommended Free Tools
Rank #2

- HIGH PRECISION ACCURACY: 2 high sensitivity satellites global GPS + GLONASS coverage for reliable surveying around the world, support for fast positioning and a reliable signal,area measurement error in 0.003 acres,it cannot be used for saving waypoints and navigation
- LARGE LCD: Our Product has a 2.4 inch FSTN panel and equipped with LCD backlight display, the measurement results can be displayed on the screen directly, convenient for observation
- RUGGED DESIGN: Our Product has a weight of approximately 180g/6.3oz and is compact, making it easy to carry. Adopts humanized groove design, easy to hold and not easy to fall off when using
- 4 IN 1 MEASUREMENT: 2 types of area measurement methods that can measure garden parking lot ranch and flat field.2 distance measurement that can measure straight and curve line distance
- !!! PLEASE NOTE:Please search satellite signals in an open outdoor area before using this device and there is no signal can be found indoors.When the signal value in the upper left corner of the device screen is below 1 m, start measuring to ensure the accuracy of this device
1. Measurement
The SBAS processing turns Sentinel-1 radar observations into a time series of ground-surface movement. In the thesis, the measured subsidence is spatially concentrated near fault structures and in areas of intensive groundwater withdrawal. The measurement stage answers “how much did the ground move, and where?” It does not, on its own, explain why.
2. Interpretation
The ensemble machine learning models learn relationships between the deformation pattern and surrounding conditions, then map susceptibility across the parish. The thesis reports Extra Trees R² = 0.92 and Random Forest R² = 0.88, with AUC values of 0.97 and 0.94 respectively. These are the thesis’s own modeling scores on its study data. They describe how closely the models reproduce that dataset, and they do not by themselves show how the models would perform in a different parish or decade.
Explainable AI is the layer that lets a reader see which inputs the models relied on. It is what turns a susceptibility map into a list of candidate drivers that engineers can test against geology and hydrology records.
Rank #3
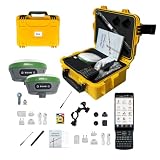
- 【High Capability & Compatibility】 The SMA26 Plus is an full-constellation RTK GNSS receiver with wide protocol compatibility, making it compatible with multiple RTK brands. Supporting PPP, PPK, and RTK technologies, it delivers versatile, high-precision performance for a wide range of surveying applications
- 【Tilt Compensation】 The SMA26 Plus RTK offers tilt measurement accuracy of up to 2.5 cm (at tilt angles ≤30°), after simple initialization, it is suitable for precise measurements in locations with limited signal or restricted space. The maximum tilt measurement angle is 60°
- 【Wide Protocol Compatibility】 SMA26 Plus GNSS RTK capable of receiving and broadcasting signals compatible with CSS(Lora),Transparent, TT450S,Trimtalk, TRMMARK3, SOUTH, SATEL standard radio protocols. ensuring compatibility with a wide range of rover&base stations
- 【Smart Handheld Collector】The SMA26 Plus GPS receiver is paired with an Android 11 handheld with 5.45" HD screen, dual SIM, 9000mAh battery, NFC, IP68 protection, dual-band RTK support, and 13MP rear camera
- 【All-in-One Integration】 The SMA26 Plus RTK GNSS receiver features built-in Bluetooth, UHF radio, WiFi, IMU, antenna, and 32GB of storage. It allows for easy switching between base station and rover modes with a single device
3. Forecast
The physics-constrained LSTM network is the forecasting component. The thesis reports R² = 0.83 and Pearson r = 0.92 for its fit. Its projection gives a mean velocity of −0.53 mm/year, accumulating to −6.42 mm across the five-year forecast period through 2030.
These are model projections. They are not measured future deformation, and the thesis presents them that way. A forecast is useful for deciding what to monitor next; it is not a prediction that a particular pavement section will reach a particular condition by a particular date.
4. Targeted follow-up
The most practical output is a shortlist. The transportation paper shows how the same logic can be applied at asset scale: PSI points that show localized movement near an interchange or bridge become candidates for ground-truth checks, such as GNSS measurements or conventional inspection. Whether a flagged location needs repair, monitoring, or nothing at all is an engineering decision that the satellite data cannot make.
Rank #4

- 【15 Kilometers】E1 RTK GNSS Surveying System with IMU has a long transmission distance, Radio range between the rover and the base can reach 15 kilometers (9.32miles). Also E1 can compatible with base stations of other brands in both Radio and CORS mode. Support RTCM v3/CMR correction data transmission.
- 【60°Tilt Surveying】E1 GNSS with IMU, can initializes in 5 seconds and supports tilt measurements up to 60°, and compatible with regular 5/8" thread poles.
- 【20 Hours Endurance 】E1 rtk provides 6700mah over 20 hours of continuous operation on a single charge, with fast Type-C charging. It employs a base station and rover with the (GPS) to attain Centimeter-Level Precision Measurement, High precision with low power consumption, small size easy to carry and operate.
- 【Various Interfaces】E1 rtk gnss survey equipment innovative integration of multiple connection methods: NFC (Touch connection) /Bluetooth/USB Type-C/WiFi/TNC Connector/RS232 Serial Port. Easily access static data download, Configuration, device Status check, and Firmware Upgrade.Improve your work efficiency by 30%!!
- 【Robust Signal Tracking】E1 GPS RTK support Full-Constellation Tracking: GPS/GLONASS/Galileo/BDS/QZSS/IRNSS/SBAS etc, an easily obtain fixed RTK solution in seconds even in challenging environments like multipath, trees, and city canyons.
What the transportation paper finds
The IEEE JSTARS paper by Ahmed Abdalla, Desmond Kangah, and Abdelrahim Salih, published June 22, 2026 (DOI 10.1109/JSTARS.2026.3705283), applies PSI, Random Forest, and SHAP to local transportation infrastructure in Baton Rouge. Its main findings fall into three groups.
Localized deformation near interchanges and bridges
The paper reports localized deformation near major interchanges and bridges across East Baton Rouge Parish. Stronger signals appear in fault-bounded corridors and in areas of stratigraphic variability, meaning zones where the underlying soil and rock layers change over short distances.
What’s actually slowing this PC down?
Pick the symptom - the matching free tool is one click away.
Controls identified by the model
The paper identifies fault proximity and lithologic variability as the dominant controls in its model, with precipitation as a secondary contributor. SHAP attributes the model’s outputs to its input variables, so these are the factors the model weighted most heavily. They are associations within this dataset and model, not established causes, and they should be read as leads for field investigation.
Best Value

- 【High-Precision Positioning & Multi-System Compatibility】The SMA25R Net Rover GPS RTK surveying equipment supports BDS, GPS, GLONASS, Galileo, QZSS, and 16-band positioning
- 【Tilt Compensation】The SMA25R Net Rover GNSS RTK offers tilt accuracy of up to 2.5 cm (CORS connection), after simple initialization, it is suitable for precise measurements in locations with limited signal or restricted space, and supports a maximum tilt measurement angle of up to 60°
- 【Flexible Connectivity & User-Friendly Software】The SMA25R Net Rover GNSS RTK is equipped with BT 4.0, allowing for seamless connection with Android phones/tablets. It is compatible with standard/professional surveying software (with functions such as surveying, marking, and CAD plotting) and various CORS systems, enabling professionals to efficiently collect and process data
- 【Long Battery Life & Convenient Charging】The SMA25R Net GNSS receiver features a built-in 4800mAh high-capacity battery, providing ≥16 hours of continuous use to meet all-day work requirements. It utilizes a universal Type-C interface, supporting charging with a power bank and Type-C firmware upgrades, allowing for flexible power replenishment anytime, anywhere
- 【Durable & Portable Design】The SMA25R Net Rover GPS surveying equipment features an IP54 waterproof and dustproof rating and 2-meter drop protection. Weighing only 0.55 kg and with a compact size (165 mm × 70 mm), it is convenient for handheld use or direct mounting on a survey pole, making it easy to carry during fieldwork
GNSS comparison as a consistency check
The paper compares the InSAR time series against independent GNSS observations. That comparison checks whether the satellite-derived movement agrees with a separate measurement system at those points. It is a validation check, not proof that every pixel or every infrastructure asset is safe. A good agreement at a set of reference stations does not certify the rest of the map.
The authors summarize their contribution this way: “By combining PSI, RF, and SHAP, the framework enhances interpretability, improves deformation-susceptibility mapping, and supports infrastructure risk assessment.” — Ahmed Abdalla, Desmond Kangah, and Abdelrahim Salih, IEEE JSTARS, 2026.
Independent reader supportYour contribution helps us test, update, and keep practical guides available for everyone.What each output can and cannot tell you
The studies produce several kinds of output. Confusing them is the most common way to misread a subsidence map.
| Output | Question it answers | What it does not answer |
|---|---|---|
| InSAR deformation time series | How much has the ground moved at a location, and when | Why it moved, or whether the movement is a structural problem |
| Susceptibility map (ensemble ML) | Which areas share conditions associated with movement | Whether a specific asset is damaged or will be |
| LSTM forecast | What the model projects if current patterns continue | Observed future deformation |
| SHAP attributions | Which input factors the model relied on most | Proven cause-and-effect relationships |
| GNSS comparison | Whether InSAR movement agrees with an independent measurement at reference points | Whether every pixel or asset has been validated |
Limits you should keep in view
- Geography. Both studies are scoped to East Baton Rouge Parish and to the datasets and models they used. Results should not be assumed to transfer to other parishes or regions without a separate analysis.
- No operational service. The cited sources do not describe an operational warning system or any measured outcome in which infrastructure was protected from damage.
- Inspection still governs decisions. The satellite and model outputs narrow where to look. Structural condition, repair priorities, and safety judgments rest with engineers working on site.
- Full text access. The LSU repository record for the thesis lists a file download date of March 26, 2029, so the full thesis is not currently downloadable from that record. The abstract and record are what is publicly available now. The IEEE paper’s text is available through ResearchGate, and its DOI is listed above.
- Forecast horizon. The projections run to 2030. Their uncertainty grows with the time horizon, and they should be refreshed as new Sentinel-1 observations are added.
How this work has been presented
The Louisiana Transportation Conference 2025 program documents an earlier poster on transportation deformation monitoring using InSAR. That poster predates the 2026 journal paper and the thesis, and the program listing is the primary record of its presentation.
If you read a subsidence map near a road or bridge
- Confirm the study area and date range before applying any finding to a nearby asset.
- Identify whether a value is measured (InSAR or GNSS) or modeled (susceptibility or forecast).
- Check the forecast horizon and treat projections as scenarios, not observations.
- Look for an independent ground check, and ask whether it covers the specific location of interest.
- Treat listed drivers such as fault proximity or lithology as reasons to investigate, not as explanations already confirmed.
- Route any flagged location to a qualified engineer for site inspection.
The Bottom Line
Kangah’s work is a measurement-and-screening pipeline. It shows, with radar time series and machine learning, where ground movement in East Baton Rouge Parish concentrates and where local transportation assets may warrant a closer look. Its forecasts and attributions are modeled outputs for that parish and period. Engineering inspection remains the step that determines whether a road or bridge needs action.
Quick Recap
Product prices and availability are accurate as of the date/time indicated and are subject to change. Any price and availability information displayed on Amazon at the time of purchase will apply.

