Recommended Free Tools
Neither GPUs nor CPUs are universally cheaper or faster for inference. A GPU usually wins compute latency and throughput when a model maps well to accelerator hardware and enough concurrent work keeps it busy. A CPU can be the better choice for small or lightly loaded models, existing CPU servers, edge deployments, or any workload where the cost and operational complexity of a dedicated accelerator are not justified.
The defensible decision is empirical: run the exact model and serving stack at the required quality, context length, concurrency and latency target, then compare useful throughput, tail latency, whole-system energy and total cost. Chip specifications or a single benchmark ratio cannot answer the question by themselves.



As an Amazon Associate I earn from qualifying purchases.
The short answer: choose for the workload, not the processor label
- Choose GPU inference when you need high concurrent throughput, low compute-side latency, large matrix operations, or a model whose framework is heavily optimized for accelerator kernels.
- Choose CPU inference when requests are infrequent, the model is small enough for available memory, you already operate CPU infrastructure, or utilization is too low to pay for a dedicated accelerator.
- Use both in one system when the GPU handles tensor computation while the CPU handles memory management, scheduling, orchestration, networking and distribution.
- Measure complete systems. A GPU server includes host CPUs, memory, storage, networking and cooling; a CPU-only server has its own memory and power costs. Comparing only accelerator TDPs or per-chip scores can reverse the apparent result.
Latency, throughput, energy and cost are separate objectives. A configuration tuned for maximum aggregate tokens per second can batch requests and increase the delay experienced by one interactive user. Conversely, a low-latency configuration may leave expensive hardware idle. Your service-level objective determines which result matters.
What inference hardware is actually doing
Inference executes a trained model to produce a prediction, classification, embedding or generated token. The arithmetic is only part of the job. Weights and activations must move through memory, requests must be scheduled, input and output must be tokenized, and results must travel over a network or to an application.
#1 Best Overall
Where a GPU helps
GPUs contain many parallel arithmetic units and very high memory bandwidth. Transformer layers, convolutions and other dense tensor operations can be divided into thousands of similar operations, so a well-optimized GPU kernel can process many values at once. Batching several requests often increases utilization and lowers the average cost per token. Specialized matrix instructions and reduced-precision formats can further increase throughput, provided the model still meets its accuracy or output-quality target.
Where a CPU helps
CPUs have fewer, more general-purpose cores, large caches and strong control-flow performance. They are effective for preprocessing, tokenization, irregular operators, small batches and workloads whose working set fits efficiently in system memory. Modern server CPUs also include vector and matrix extensions. Intel’s MLPerf Inference v6.0 announcement, for example, describes Xeon 6 P-cores using AMX and AVX-512 for inference and reports up to a 1.9× generational performance gain in MLPerf Inference v5.1. That is an Intel-reported generational CPU result, not a universal CPU-versus-GPU ratio; Intel notes that performance varies by use and configuration.
Why a GPU system still needs a CPU
The host CPU normally manages memory allocation, request queues, data loading, process supervision, networking and distribution across devices. If the host cannot feed the accelerator quickly enough, GPU utilization falls and end-to-end latency rises. A fair comparison therefore measures the complete serving system, not a GPU in isolation.
Latency and throughput are different measurements
| Metric | What it tells you | Typical question |
|---|---|---|
| Time to first token (TTFT) | Delay before a generative response starts | How long does an interactive user wait? |
| Per-token or inter-token latency | Spacing between generated tokens after the first | Does text stream smoothly? |
| End-to-end latency | Queueing, preprocessing, model execution and post-processing together | What does the application actually experience? |
| Tail latency (p95, p99) | Slow requests under realistic load | How often do users breach the service target? |
| Throughput | Requests or tokens completed per second | How much work can the service process? |
A single-user test can favor a different configuration than a 64-user test. Increasing concurrency may improve GPU efficiency but create queueing delay. Dynamic batching, speculative decoding and memory paging can change both curves. Record latency at the concurrency your application will actually sustain, and report the concurrency alongside every throughput number.
For interactive generation, define a target such as TTFT below a chosen threshold and a minimum streaming rate. For offline summarization or embedding jobs, total tokens per hour and energy per document may matter more than the first-token delay. Do not call a system “faster” without stating which of these measurements you mean.
Rank #2

- NVIDIA Volta GV100 Architecture — 4,608 CUDA Cores, 640 1st-Gen Tensor Cores delivering 14 TFLOPS FP32 and 112 TFLOPS deep learning performance for AI training, inference, HPC, and scientific computing workloads
- 32GB HBM2 ECC Memory — 900 GB/s Bandwidth — High-bandwidth memory on a 4096-bit bus with ECC error correction provides the memory capacity and throughput required for the largest AI models, simulations, and datasets
- PCIe 3.0 x16 Interface — 250W TDP — Standard PCIe Gen3 connectivity with passive cooling designed for enterprise rack server deployment in HPE ProLiant, Dell PowerEdge, and Supermicro platforms with adequate chassis airflow
- NVLink — Scale to 96GB Unified Memory — Connect two V100 GPUs via NVLink at 300 GB/s bi-directional bandwidth to scale GPU memory from 32GB to 96GB for larger AI training and HPC workloads
- Multi-Precision Computing — Supports FP64 (7 TFLOPS), FP32 (14 TFLOPS), FP16 (112 TFLOPS) and INT8 precision modes for flexible deployment across training, inference, and scientific simulation workloads
What determines GPU-versus-CPU performance
The same processor can look excellent or poor when any of these variables changes:
- Model architecture and size: dense transformers, mixture-of-experts models, convolutional networks and classical ML use different kernels and memory patterns.
- Input and output length: long context increases memory traffic and attention work; long generated output increases decode time.
- Precision and quantization: FP32, FP16, BF16, INT8 and lower-bit formats change memory use, arithmetic rate and sometimes quality.
- Batch size and concurrency: larger batches can raise accelerator utilization but add queueing and memory pressure.
- Framework and kernels: graph compilation, operator fusion, attention implementations and vendor libraries can dominate hardware differences.
- Serving topology: one device, multiple devices, tensor parallelism, pipeline parallelism and network links add different synchronization costs.
- Quality target: a faster quantized model is not an equivalent result if it fails the required accuracy or generation-quality test.
- Data movement: copying prompts or weights between host and device, or between distributed devices, can erase compute gains.
AMD’s guidance is explicit: “The right evaluation is to run your model, with your context length, latency target, and concurrency, on both platforms.” That principle applies even when published benchmarks appear close.
Build a cost-per-useful-output model
“Cost per token” is a scenario result, not a permanent property of a chip. Calculate it from the resources required to meet your quality and latency target.
| Cost component | What to include | Common omission |
|---|---|---|
| Hardware or rental | Purchase depreciation, lease or cloud hourly rate; include host CPU, memory and networking | Counting only the accelerator price |
| Utilization | Expected busy hours, concurrency and idle time | Assuming 100% utilization for an interactive service |
| Energy | Measured wall power multiplied by runtime and electricity rate | Using chip TDP as if it were measured consumption |
| Software and operations | Runtime support, orchestration, monitoring, drivers, cooling and staff time | Ignoring integration and maintenance work |
| Output delivered | Accepted requests or tokens that meet quality and latency objectives | Dividing cost by raw, unusable throughput |
A practical calculation is cost per useful token = (hardware allocation + energy + operations) / accepted output tokens. For a purchase, allocate the hardware over its accounting life and realistic utilization. For a rental, multiply the measured hourly rate by the hours needed to produce the workload. Keep one-time capital expenditure separate from recurring operating cost so that a low-utilization service does not hide an expensive idle device.
Measure energy at the wall
MLCommons’ MLPerf Inference methodology measures average AC power consumed by the entire system at the wall during the accompanying benchmark. Its guidance states: “The measured power is only valid for the accompanying benchmark.” It also says TDP and power-supply ratings are not MLCommons-validated measurements. Therefore include the host CPU, memory, fans, storage and networking in energy-per-request calculations, and do not infer system power from an accelerator specification.
Rank #3
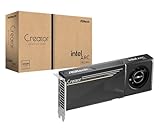
- System Compatibility Note: 2-slot card, 271x112x39mm, single 8-pin power, 200W TDP. Verify chassis clearance and PSU capacity before purchase.
- Dedicated Support: Please contact us directly through Amazon for any product questions or assistance you may require.
- 24GB GDDR6 on 192-Bit Bus: Massive 24GB memory with 456 GB/s bandwidth – ideal for LLMs, AI inference, 3D rendering, and generative design.
- Intel Xe2-HPG Architecture: Built on Intel's next-gen architecture with 20 Xe cores and 160 XMX engines for AI acceleration (197 INT8 TOPS).
- PCIe 5.0 Support: PCI Express 5.0 x16 interface for maximum bandwidth with the latest workstation platforms.
Why utilization changes the answer
A GPU that is twice as productive while busy can still have a higher monthly cost if it serves a few requests each hour. A CPU server already paid for and running other services may have near-zero incremental capital cost for a small inference job. Conversely, a heavily loaded CPU cluster can require many machines, memory upgrades and more electricity; consolidating that work on one well-utilized accelerator may reduce total cost.
What’s actually slowing this PC down?
Pick the symptom - the matching free tool is one click away.
Evidence from published benchmarks—what it does and does not prove
MLPerf Inference
MLCommons defines MLPerf Inference workloads with specified datasets and quality targets. Its system-level power results are valuable because they measure the complete machine, but they remain valid only for the benchmark they accompany. A score from one model, batch mode or latency scenario should narrow your shortlist, not substitute for a test of your deployment.
A controlled edge and server study
A September 2026 arXiv preprint, “A Measurement Study of LLM Inference Trade-offs Across Edge Continuum Hardware,” tested open-weight LLMs on an NVIDIA Jetson AGX Orin and a near-edge server in CPU-only and GPU-enabled modes. It used fixed question-answering workloads and multiple model and quantization variants. In that setup, GPU-enabled server execution had the lowest compute-side latency, the Jetson Orin had lower measured energy, and CPU-only execution had higher latency and energy. Those findings are bounded by the tested models, hardware, fixed prompts and deployment nodes; they are not a general law that every GPU is faster or every edge device is more efficient.
Vendor-reported distributed GPU figures
AMD’s March 2026 technical article reports a DeepSeek-R1 comparison at 129 tokens per second per user. The following values are vendor-reported and tied to the named software, model, concurrency and distributed configurations:
| Configuration | Reported cost | Reported throughput | Scope |
|---|---|---|---|
| MI355X with MoRI/SGLang, 24 GPUs | $0.173 per million tokens | 2,378 tokens/second/GPU | DeepSeek-R1 at 129 tokens/second/user |
| B200 with Dynamo/TRT-LLM MTP, 28 GPUs | $0.178 per million tokens | 3,128 tokens/second/GPU | Same stated interactivity target |
| B200 with Dynamo/SGLang MTP, 48 GPUs | $0.284 per million tokens | 1,945 tokens/second/GPU | Same stated interactivity target |
These numbers compare distributed GPU deployments, not GPUs against CPUs. The change between B200 software/topology combinations shows why framework, speculative decoding or multi-token prediction, sequence length and scaling arrangement must be reported with a result.
Historical per-chip ratios
An NVIDIA overview of MLPerf Inference v1.1 published a per-chip table with GPU-to-CPU relative performance as high as 104× for speech recognition in one listed scenario. That figure is historical, per-chip and workload-specific. It should not be presented as a current ratio, a system-level energy result or a prediction for modern LLM inference.
A repeatable comparison procedure
- Define the service objective. Write down the model version, quality or accuracy test, maximum context, expected input and output lengths, target TTFT, streaming rate, tail-latency percentile and concurrency.
- Freeze the software. Record the framework, runtime, compiler settings, quantization, attention kernel, batching policy, tokenizer and driver versions. Use the same model weights and prompt set on both platforms.
- Prepare representative traffic. Use a replayable sample of prompts or inputs, including short and long contexts and the expected request mix. Do not benchmark only a synthetic one-token prompt if production requests are long.
- Warm up and verify quality. Load weights, run warm-up requests, confirm outputs meet the same accuracy or evaluation threshold, then begin timed runs. Exclude one-time model-loading time when measuring steady-state serving, but report cold-start time separately if it matters to your application.
- Sweep concurrency and batch size. Test single-user latency, the planned operating point and overload conditions. Record throughput, TTFT, per-token latency, p95 or p99 latency, queue time and failures for every point.
- Measure whole-system power. Capture wall power for the host, accelerator and peripherals during the same run. Convert watt-hours to energy per request or per accepted token.
- Apply realistic economics. Add purchase or rental cost, utilization, electricity, software and operational overhead. Allocate costs to useful output that passes the quality and latency gates.
- Check scaling behavior. If more than one device is required, measure communication, synchronization and network overhead. A linear increase in device count is not guaranteed.
- Choose the simplest system that meets the target. Prefer the option with acceptable tail latency and cost at expected utilization, not the one with the largest peak benchmark number.
Which workloads usually favor each option?
Interactive chat and coding assistants
These services care about TTFT, smooth token streaming and tail latency. A GPU is often attractive when many simultaneous sessions keep it occupied and the model fits its memory. Dynamic batching can lower cost but must be tuned so queueing does not violate the user target. A CPU may be adequate for a small local model, a low-traffic internal tool or a deployment where adding a GPU would leave it mostly idle.
Offline batch generation, embeddings and transcription
Batch jobs can accumulate enough parallel work for a GPU to deliver high throughput. The relevant comparison is tokens, documents or audio minutes per hour and energy per completed item. If the job runs only occasionally, include startup, rental and idle costs; an existing CPU cluster may be economically preferable.
Small models and classical machine learning
Tree models, linear models, small vision networks and compact language models may spend more time in data movement and preprocessing than in large matrix multiplications. A CPU can provide simpler deployment and predictable latency, especially when the data already resides in CPU memory. Test vectorization and thread scaling before assuming a GPU is needed.
The Tool Desk
Outbyte Driver Updater FREEScan for outdated or missing drivers - takes under a minuteDriver Scan →Outbyte PC Repair FREEClear out junk files and repair common Windows errorsFree Scan →Long-context or memory-bound models
Large weights and long key-value caches can exceed accelerator memory or force transfers between host and device. A CPU server with abundant RAM may run the model at lower speed, while a GPU system may require multiple devices and high-speed interconnects. Compare the complete multi-device topology, not just nominal arithmetic throughput.
Edge and offline operation
Power, size, cooling, availability and privacy can outweigh peak speed. The Jetson Orin study illustrates that an edge GPU configuration can use less measured energy than a nearby server even when the server GPU has lower compute-side latency. Measure the complete edge appliance under its actual duty cycle.
Existing CPU infrastructure
If your organization already operates spare CPU capacity, the incremental cost of deploying a small model may be low. CPU inference also avoids accelerator driver, runtime and scheduling complexity. Reassess when CPU utilization, latency or energy crosses a measured threshold; do not wait for a theoretical speed ratio.
Common mistakes and how to correct them
- Comparing peak FLOPS or TOPS: Replace specification comparisons with end-to-end tokens or requests at the required quality and latency.
- Reporting average latency only: Add p95 or p99 latency and queue time so overload behavior is visible.
- Using a different precision on each platform: Verify equivalent quality, or label the comparison as a quality trade-off rather than a speed win.
- Ignoring context length: Benchmark the production distribution of prompt and output lengths; short prompts can hide memory and attention costs.
- Equating TDP with energy: Use wall measurements for the complete system, as MLPerf requires for its power results.
- Assuming published GPU cost figures include CPUs: Check the cost boundary, number of devices, software stack and utilization assumptions before applying a vendor number.
- Benchmarking only maximum batch size: Include the single-user and latency-constrained operating points that customers experience.
- Ignoring software maturity: Confirm that the chosen runtime supports your model operators, quantization, monitoring and failover requirements.
- Treating one historical ratio as current: Date and scope every external result; the 104× MLPerf v1.1 per-chip example is not a modern universal multiplier.
- Forgetting host work: Profile tokenization, data loading, networking and orchestration. A saturated CPU can bottleneck an otherwise capable GPU.
A decision scorecard you can reuse
| Question | If the answer is “yes” | What to investigate |
|---|---|---|
| Do you need high concurrency and high token throughput? | GPU becomes more attractive | Batching efficiency, memory capacity and tail latency |
| Is traffic sparse or unpredictable? | CPU may have lower total cost | Idle power, existing capacity and cold-start requirements |
| Does the model fit comfortably in CPU memory but not one GPU? | CPU or multi-GPU topology may be required | Transfer and interconnect overhead |
| Can the runtime exploit GPU kernels and quantization? | GPU gains are more likely | Operator coverage and quality validation |
| Is the deployment power- or space-constrained? | An edge accelerator or efficient CPU may win | Measured wall energy over the real duty cycle |
| Are you already paying for CPU servers? | CPU has a capital-cost advantage | Incremental energy, utilization and latency headroom |
| Will you distribute across many devices? | System topology becomes decisive | Network bandwidth, synchronization and software scaling |
Keep the raw measurements with the scorecard. Record hardware model, memory, software versions, precision, prompt distribution, concurrency, quality result, latency percentiles, wall power and accounting assumptions. That audit trail makes a later hardware refresh comparable instead of restarting from marketing numbers.
Quick wins for a faster PC:
Repair Windows errors before they cause bigger problemsFix Now →Fix the driver behind crashes, sound loss and screen glitchesFind Drivers →What to buy or deploy locally
If you are selecting physical hardware for local inference, start with the model’s memory requirement and runtime support rather than a product name. Confirm that the device can hold weights, activations and the expected key-value cache at your chosen precision, then check sustained power, cooling, driver support and the number of simultaneous users. Datacenter benchmark results do not establish the performance of an unspecified consumer card.
For CPU deployments, select a processor and server platform with enough memory bandwidth and capacity, vector or matrix support appropriate to the runtime, and sufficient cores for both inference and host duties. Intel’s Xeon 6 results demonstrate that current server CPUs can accelerate inference without a dedicated accelerator in supported workloads, but they do not make a CPU a drop-in replacement for every GPU-optimized model.
Bottom line for a purchasing decision
Start with the service target, then benchmark CPU-only, GPU-enabled and—where necessary—mixed configurations using the same model, quality threshold, context lengths and concurrency. Select the configuration that meets tail latency and throughput requirements at the lowest measured cost per useful output and acceptable whole-system energy. GPUs often dominate when parallel work is abundant; CPUs often win on simplicity and economics at low utilization. The workload and serving system, not the hardware category alone, determine the result.
Quick Recap
Product prices and availability are accurate as of the date/time indicated and are subject to change. Any price and availability information displayed on Amazon at the time of purchase will apply.
Do these 3 things before closing this tab:
1Scan for outdated or missing drivers - takes under a minute2Repair Windows errors before they cause bigger problems3Fix the driver behind crashes, sound loss and screen glitches
