There is no single “best” free homelab tool. Start with the question you need answered: Is the service reachable? Why is this host slow? What are my switches and firewall doing? Can every device use a DNS blocklist? or How can I reach Proxmox safely while away? The eleven tools below are organized around those jobs, with their deployment effort, coverage and failure modes made explicit.
Choose the tool by the question, not by popularity
Availability monitoring and performance monitoring are different jobs. An uptime checker requests a URL, TCP port or other endpoint and tells you whether it responds, often sending an alert. Metrics monitoring collects CPU, memory, disk, network and application measurements so you can investigate a slowdown and inspect history. A homelab can need one, both or neither, depending on what you run. The following map uses the capabilities described in a monitoring comparison updated August 3, 2026; it is a practical guide, not a controlled benchmark of current releases (monitoring-tool comparison).


As an Amazon Associate I earn from qualifying purchases.
| Question | Start here | What it is for |
|---|---|---|
| Is my service reachable? | Uptime Kuma | Up/down checks, notifications and a status page |
| Why is one host slow? | Netdata or Beszel | Per-host or lightweight multi-server metrics |
| Do I need detailed, queryable history? | Prometheus with Grafana | Custom metrics collection, dashboards and longer-term analysis |
| Do I need one view of many hosts and devices? | Zabbix | Centralized host and network monitoring |
| What are my switches, router or firewall doing? | LibreNMS or Zabbix | SNMP-oriented network-device monitoring |
| Can all household devices use DNS filtering? | Pi-hole | Network-wide DNS sinkholing |
| How do I administer Proxmox remotely? | Tailscale | Private remote access without opening inbound firewall ports |
| How should I package supported services? | Docker | Container deployment where the project documents it |
Free software still requires a host, storage, updates, backups and your time. The monitoring comparison does not establish universal CPU, memory, reliability or retention figures, so treat the effort descriptions below as trade-offs rather than promises.
1. Uptime Kuma answers “Is it up?”
Uptime Kuma is the low-friction choice when the immediate question is whether a service responds. The comparison describes checks for availability, notification destinations and a shareable status page. It is useful for a home dashboard, a web application, a game server or a service exposed only inside your LAN.
What to configure
- Create a monitor for the protocol the user actually needs: an HTTP endpoint for a web app, a TCP check for a port-only service, or another check type supported by your installation.
- Set a notification channel so a failed check does not remain unnoticed on the same dashboard.
- Use the status-page feature when family members or lab users need a simple operational view rather than administrative access.
An uptime result does not explain why a host is slow, whether a disk is filling or how resource use changed over the past week. Pair it with a metrics tool when diagnosis matters. Also consider placement: if the monitored service and Uptime Kuma run on the same failed host, both disappear together. A second, independent location is a sensible design consideration, not a feature verified by the comparison.
2. Netdata gives a fast per-host performance view
Netdata is described as a per-node metrics tool. Install it where the workload runs when you want an immediate view of CPU, memory, disks, network traffic and other host signals without first designing a central monitoring system. This model is convenient for a small number of machines and for investigating a single noisy virtual machine.
Choose it when
- You want detailed, near-real-time visibility on each node.
- You prefer a local dashboard and can tolerate managing an agent on every host.
- You are troubleshooting now rather than building a large, long-retention metrics platform.
The comparison does not supply a universal resource footprint or retention guarantee. Check the current Netdata documentation for the release and collection settings you plan to use; do not assume the experience on one host applies to every container or operating system.
The Tool Desk
Outbyte Driver Updater FREEFix the driver behind crashes, sound loss and screen glitchesFind Drivers →Outbyte PC Repair FREERepair Windows errors before they cause bigger problemsFix Now →3–4. Prometheus and Grafana form a customizable metrics stack
Prometheus is the collection and time-series component; Grafana is commonly used to query that data and present dashboards. The comparison treats “Prometheus with Grafana” as a customizable metrics stack rather than a single turnkey monitor. It suits a homelab owner who wants to choose exporters, labels, recording rules, alert conditions and dashboards.
Rank #2

- 【Powerful Load-bearing】12U Network Rack Open Frame is constructed from durable cold rolled steel; Rack shelf supports enhance stability, wall-mounted capacity of 130lbs, the ground-mounted up to 260lbs
- 【Considerate Designs】Open-frame layout, including a top panel adding space, anti-slip shelf stops fixing devices and compatible racks for stack and expansion to meet requirements of home server rack
- 【Complete Accessories】A 12U open frame server rack, two ventilated shelves, four shelf stops, four velcro straps and a set of equipment mounting screws
- 【Versatile Application】Ideal for space-efficient multi-device setups in warehouses, retail, classrooms, offices and more; Excellent choices as AV Rack/IT Rack
- 【Effortless Setup】 Network Rack includes hardware, a comprehensive manual, mounting hole drilling template and an online assembly video to simplify setup
What the extra flexibility costs
- You must decide which exporters or application integrations expose the measurements you need.
- You must design scrape targets, retention and alert rules instead of relying only on a point-and-click default.
- You operate more than one moving part: the collector, dashboard service and any exporters or storage configuration.
This stack is strongest when you need to ask questions across time—such as whether memory pressure preceded a restart—or combine measurements from several hosts. It is more setup than a single-node dashboard, and the cited comparison does not establish a fixed installation time, resource requirement or retention period. Plan storage and backups for the history you decide to keep.
5. Zabbix centralizes hosts and network devices
Zabbix is the broad, centralized option in the comparison. It is described as monitoring hosts and network devices from one system, making it a candidate when your lab has servers, virtual machines and infrastructure equipment that should share alerting and inventory.
Use Zabbix when scope matters more than simplicity
A central system can give you one alerting policy and one place to correlate failures, but it introduces more configuration and maintenance than a per-host tool. You will need to define what each host should report, how alerts should be routed and how historical data should be retained. The comparison identifies Zabbix’s coverage and centralized model, not a guaranteed feature set for every current edition, so confirm current agent, SNMP and dashboard requirements before deployment.
What’s actually slowing this PC down?
Pick the symptom - the matching free tool is one click away.
6. Beszel is a lightweight multi-server view
Beszel is presented as a lightweight way to see metrics from multiple servers. It occupies the middle ground between a dashboard on one machine and a fully engineered metrics stack: useful when you have several hosts but do not want to assemble extensive exporters, queries and retention policies.
Rank #3
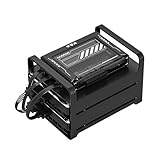
- 【Build Your Own NAS & Homelab — Not Just Storage】 More than a traditional NAS, ZimaBlade 7700 is a flexible x86 mini server for building your own homelab, personal cloud, or Docker host. Perfect for DIY NAS, self-hosting, container apps, and even retro systems — not limited like typical ARM-based NAS devices.
- 【x86 Platform — Broad Compatibility, Real Freedom】 Powered by an Intel quad-core x86 processor, it runs a wide range of operating systems and software with native compatibility. Ideal for Linux, Docker, CasaOS, and more — designed for flexibility and experimentation rather than locked-down appliance use.
- 【16GB RAM for Smooth Multi-Service Workloads】 Handle file sharing, media streaming, backups, and multiple lightweight services at once. Optimized for low-power, always-on operation — a great fit for home labs and personal servers running 24/7.
- 【Smooth 4K Media Streaming — Plex Direct Play Ready】 Stream your personal media library smoothly with Plex and similar media servers. Supports 4K playback on compatible devices via direct play, delivering a reliable home media experience without the need for heavy transcoding.
- 【Complete 2-Bay NAS Kit — Ready to Build】 Includes power supply, 16GB RAM, metal drive cage for 2 HDD/SSD, and dual SATA cables — everything you need to start building your own NAS right out of the box.
Questions to answer before choosing it
- Which operating systems and deployment method does the current release support?
- How much history do you need, and is its retention model sufficient?
- Do its alerts reach the channels you already use?
Those details can change with releases and are not quantified in the comparison. Evaluate the current documentation against your host count and alerting requirements rather than treating “lightweight” as a measured performance claim.
7. LibreNMS focuses on SNMP-capable network equipment
LibreNMS is the network-oriented candidate for switches, routers and firewalls that expose SNMP. The comparison highlights SNMP discovery and device coverage, which are different from checking whether a web page returns HTTP 200.
Why SNMP changes the monitoring job
Network hardware can report interface traffic, errors, temperatures and other device counters even when no web service is available to test. LibreNMS can therefore show that a link is saturated or an interface is accumulating errors. You still need to configure SNMP on the device, restrict who can query it and decide which alerts are actionable. The comparison does not provide a universal list of supported models or a benchmark of discovery speed; verify your equipment against the current LibreNMS documentation.
Recommended Free Tools
8. Checkmk Raw covers host and service checks
The Raw edition of Checkmk appears in the comparison as an option for host and service checks. It can be considered when you want checks beyond simple reachability and prefer a monitoring system organized around hosts, services and alert states.
Before installing, list the checks you actually require—processes, filesystem thresholds, certificates, ports or application responses—and confirm that the current Raw edition supplies them without an edition-specific feature you cannot use. The comparison establishes its host/service-check role, but not current licensing details, resource figures or every integration, so those should be checked in the project’s current documentation.
9. Pi-hole filters DNS requests for the whole network
Pi-hole is a free, open-source DNS sinkhole that runs on Linux hardware. Instead of installing a blocker separately on each client, devices send DNS queries to Pi-hole, which can refuse domains on its configured lists. The project overview describes minimal hardware requirements and says Pi-hole can optionally provide DHCP (Pi-hole overview).
Check these prerequisites first
- Confirm that the intended host meets the current hardware and operating-system prerequisites in Pi-hole’s getting-started guide (Pi-hole getting started).
- Decide whether you will install normally on Linux hardware or use the documented Docker path. Docker is an option, not a requirement.
- Verify that you control the router or DHCP service well enough to advertise Pi-hole as the DNS server. Installing the software alone does not redirect client queries.
- Plan a fallback DNS arrangement if the Pi-hole host is powered off or unreachable. A single DNS server can make every client appear offline even though the internet connection is healthy.
- Identify devices that need exceptions, such as appliances or work systems whose vendors require particular domains.
What Pi-hole does not guarantee
DNS sinkholing can block domains present in the lists you configure, but it is not a promise that every advertisement, tracker or malicious site will be stopped. It is not a complete endpoint-security product, and the cited project pages do not establish universal blocking. Treat filtering as one network control, keep clients and services maintained, and use explicit allowlists when a legitimate service breaks.
10. Tailscale provides a deliberate remote path to Proxmox
Tailscale’s Proxmox integration guide, last validated January 5, 2026, documents accessing a Proxmox console from anywhere without opening firewall ports or manually configuring a VPN (Tailscale on a Proxmox host). This is a documented setup for that integration, not a claim that every remote-access design is automatically secure.
Best Value
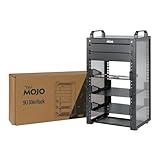
- Compact 10-Inch Width & 9U Height: This mini rack is designed for efficient equipment organization, featuring a space-saving 10-inch width and standard 9U height - ideal for desktops, home labs, small offices, or AV setups
- Versatile Accessory Compatibility: Supports 10-inch rack-mountable equipment, including patch panels, network switches, cable organizers, and power strips, providing flexible solutions for networking and electronics projects
- Durable Steel & Acrylic Construction: Constructed from high-strength steel with premium acrylic side panels, this rack offers outstanding durability and stability - perfect for NAS, custom clusters, and sensitive electronics
- Open-Frame & Translucent Panel Design: The open-frame structure ensures superior airflow for optimal cooling, while translucent side panels offer dust protection and allow easy monitoring of device indicators—ideal for performance and ambient lighting enhancements
- Complete Accessory Kit Included: Includes 2 blank panels, 2 rack shelf, 1 SBC shelf, 2 micro adapter boards, and all necessary mounting hardware - everything needed for a streamlined, customizable installation
Remote-access sequence
- Install Tailscale on the Proxmox host following the integration guide and authenticate it to your tailnet.
- Connect your administration device to the same tailnet and confirm that the Proxmox host is reachable over its Tailscale address.
- Open the Proxmox web interface over HTTPS. Proxmox uses port 8006 by default.
- Handle the certificate warning deliberately. The guide notes that the default certificate is self-signed and documents using a Tailscale certificate or Tailscale Serve as alternatives.
- Keep Proxmox accounts, access permissions, device approvals and update practices under your control; the integration does not remove the need for those safeguards.
Do not expose the management interface to the public internet merely because remote access is convenient. The value of this approach is a private connection model that avoids inbound port forwarding, while administration still depends on strong account and device controls.
11. Docker is a deployment choice, not a universal answer
Docker belongs on this list because installation method affects operations as much as the application itself. Pi-hole’s getting-started documentation presents Docker alongside a normal installation (installation options). Other projects may document containers, packages or agents instead; do not assume that every tool here should run in Docker.
Use containers when the project supports your host
- Confirm the project’s supported operating system, architecture and container instructions before deployment.
- Persist configuration and data outside the disposable container layer so a recreation does not erase settings or history.
- Write down ports, environment variables, secrets and volumes before upgrading.
- Back up those persistent directories and test restoration, not just backup creation.
- Have a rollback plan for image updates and monitor the host that runs the containers.
Container isolation does not make an application maintenance-free. You still patch the host, images and application, and you still need enough storage for logs and metrics.
Do these 3 things before closing this tab:
1Clear out junk files and repair common Windows errors2Scan for outdated or missing drivers - takes under a minute3Repair Windows errors before they cause bigger problemsA practical build order for a small homelab
Start with the failure that would inconvenience you most, then add the layer that explains it. A sensible sequence is:
- Deploy Uptime Kuma on a host that is not the only host running the service you care about, and configure a notification destination.
- Add Netdata or Beszel to the machines where you need quick performance visibility.
- Move to Prometheus with Grafana when you need cross-host queries, custom exporters or longer historical analysis; choose Zabbix instead when a centralized host-and-device system better matches your inventory.
- Add LibreNMS for SNMP-capable switches, routers or firewalls, or use Zabbix if you want those devices in the same central system.
- Install Pi-hole only after confirming router/DHCP control and a recovery plan for DNS.
- Set up Tailscale for remote Proxmox administration and resolve the HTTPS certificate choice before you are away from home.
- Standardize on Docker only where each project documents it and where you can protect persistent data.
Keep at least one monitoring path independent of the host or network segment it is meant to report on. Otherwise a power failure, switch outage or hypervisor crash can remove both the problem and the evidence of the problem.
Common failure modes and the first fix
- “Pi-hole is installed, but ads and telemetry are unchanged.” Check the router’s DHCP/DNS advertisement and the client’s actual DNS server; installation does not reconfigure the network automatically.
- “Monitoring says everything is down during a reboot.” Place the checker elsewhere or accept that a same-host monitor cannot report a same-host failure.
- “Metrics are empty.” Verify that the agent or exporter is running, the target address is reachable and the collector is configured for that target.
- “The network dashboard has no switch data.” Confirm that SNMP is enabled on the device, credentials or community settings match and the monitoring host can query the management interface.
- “Proxmox works remotely but shows a certificate warning.” Remember that port 8006 uses HTTPS and the default certificate is self-signed; use the certificate or Serve option documented by the Tailscale integration.
- “A container update lost the configuration.” Inspect volume mappings and restore from a tested backup before repeating the upgrade.
What “free” actually means in a homelab
The software candidates above may be free or open source, but operation is not costless. You need Linux-capable hardware for Pi-hole, storage for metrics and logs, electricity, network equipment that exposes the interfaces you want to monitor, and time for updates and recovery testing. The Pi-hole project does not establish compatibility for a particular Raspberry Pi generation in the cited pages, so check the current prerequisites before buying any single-board computer. A spare Linux machine or an existing server may be a better fit.
Choose the smallest system that answers your question, keep configuration reproducible, and document what happens when the host, DNS service, monitoring database or network link fails. That operational plan is what turns a collection of free downloads into a dependable homelab.
Quick wins for a faster PC:
Clear out junk files and repair common Windows errorsFree Scan →Fix the driver behind crashes, sound loss and screen glitchesFind Drivers →Repair Windows errors before they cause bigger problemsFix Now →Quick Recap
Product prices and availability are accurate as of the date/time indicated and are subject to change. Any price and availability information displayed on Amazon at the time of purchase will apply.

