The Tool Desk
Outbyte PC Repair FREERepair Windows errors before they cause bigger problemsFix Now →Outbyte Driver Updater FREEScan for outdated or missing drivers - takes under a minuteDriver Scan →Error tracking, uptime monitoring, and cron heartbeats answer different reliability questions. Error tracking captures failures reported by running application code; uptime checks test whether an endpoint responds; a cron heartbeat shows whether a scheduled task checked in on time. A storefront can pass an uptime check while an important background job has stopped, so high-impact workflows may need their own completion signals.
What each signal tells you
| Signal | What initiates it | What it can establish | What it cannot establish by itself | Storefront example |
|---|---|---|---|---|
| Error tracking | Instrumented application code reports an exception or error. | A captured code failure occurred, along with whatever debugging context was configured. | That a task which never started—or never emitted a reportable error—failed. | An exception in an application API or checkout extension. |
| Uptime monitoring | An external service probes a reachable HTTP endpoint. | The endpoint responded according to the configured check. | That a separate background task ran or completed. | A public storefront or API endpoint responds. |
| Cron heartbeat | A scheduled task sends a request to its monitor URL. | The task sent a check-in within its expected schedule window. | That the task produced correct data or completed its downstream business outcome. | A catalog import, fulfillment export, or inventory sync checks in. |
These mechanisms observe different events. Better Stack describes a heartbeat as a monitor that expects regular requests to a unique URL; if the request misses the expected frequency and grace period, it can trigger an incident. UptimeRobot likewise describes the reverse-check-in model: the monitored task sends the request instead of the monitoring service probing the task. Better Stack heartbeat documentation; UptimeRobot heartbeat help.

As an Amazon Associate I earn from qualifying purchases.
Why a storefront needs more than an uptime check
A successful HTTP response is evidence about the endpoint that was checked, not about every process supporting the store. A catalog import can stop, an inventory update can stall, or an export can fail while the public storefront continues to respond. Conversely, a heartbeat may arrive even though the task processed incorrect data or did not complete the business action that matters.
Quick wins for a faster PC:
Clear out junk files and repair common Windows errorsFree Scan →Scan for outdated or missing drivers - takes under a minuteDriver Scan →Repair Windows errors before they cause bigger problemsFix Now →Shopify’s Hydrogen production checklist recommends monitoring storefront health using signals such as uptime, log error counts, or site performance, and setting alerts on critical events and metrics. For a storefront, that supports a layered approach: observe the customer-facing endpoint, collect application failures, and add completion evidence for consequential scheduled workflows. The specific workflows depend on the store; Shopify’s checklist does not require the examples above. Shopify Hydrogen production checklist.
#1 Best Overall

- Automatic Router Rebooter / Reset - Stop manually restarting your router! Automate the process to ensure highly reliable internet connection uptime
- Constantly Monitors Router and/or Modem Internet Health. Keep Connect provides 24/7/365 protection to ensure that your smart home and connected devices are always online and available.
- Notifications - Free Texts or Emails from Keep Connect notifying you of detected eventsif you choose to enter your phone number/email. You may also choose No Notifications.
- Perfect for Smart Home Reliability - Schedule Periodic Resets to keep your connection fresh and fast.
- Premium Cloud Services App Available (iOS App Store and Google Play Store) - Our Premium Keep Connect Cloud Services platform allows using our Online/Mobile App to monitor many locations in one place as well. Cloud Services allows remote management of devices at all locations as well as heartbeat monitoring of your Keep Connects to notify you in the event of an ISP internet outage at one of your sites.
How to make a heartbeat useful
- Choose a job with a meaningful failure impact. Consider scheduled catalog or inventory synchronization, fulfillment exports, and queue processing where a silent missed run could leave the store or its operators with stale or incomplete work.
- Set the expected cadence and grace period. Configure the monitor around the task’s actual schedule. The grace period gives a late run some room before an alert; it should not be mistaken for proof that the task completed successfully.
- Send success only after the work and checks finish. Place the success request after the meaningful processing has completed and any required success criteria have passed. A ping at job start only shows that execution began.
- Report failure and preserve diagnostic context. Where supported, send an explicit failure signal or useful exit status and output. Better Stack documents a
/failendpoint and an example that submits output and an exit code. Keep task identifiers and logs so an alert can lead to investigation rather than merely confirm a missed check-in. Better Stack heartbeat documentation. - Verify the alert path. Confirm that a deliberately missed or failed check-in produces the intended notification and that the alert identifies the relevant job. A configured monitor is only useful operationally if someone can act on its signal.
A heartbeat is still a narrow signal: it confirms that a request arrived, not that records were accurate, enough items were processed, or downstream systems accepted the result. Those outcomes require job-level checks or other business-process evidence.
Shopify signals have distinct scopes
Checkout UI extension errors
Shopify’s checkout UI extension documentation describes attaching listeners for unhandled promise rejections and other errors. It also notes that third-party error reporting may need extra configuration because extensions run in a Web Worker, and that network access must be requested to transmit errors to a third party. Shopify provides a Sentry example. This guidance is specific to checkout UI extensions; it should not be generalized to every Shopify storefront implementation. Shopify Checkout UI extensions documentation.
Webhook delivery
Shopify says failed webhook deliveries are retried, and persistent failures can result in a webhook subscription being removed. Delivery metrics and logs can help investigate; recovery may require importing data missed during an outage. A healthy storefront endpoint therefore does not establish that every integration workflow is receiving and processing events. Shopify webhook troubleshooting.
App monitoring dashboards
Shopify’s Dev Dashboard monitoring documentation describes operations charts and logs for app activity. An empty timeline does not prove that nothing happened, because some browser-to-backend requests are not represented there. As with any dashboard, its evidence is limited to the activity it can observe. Shopify app performance monitoring.
Rank #3
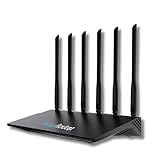
- 24/7 Internet Uptime with Self-Healing Technology – Proactively monitors your network, performs automatic reboots, and ensures uninterrupted connectivity without manual intervention.
- Smart Power Cycling for Speed Optimization – Seamlessly integrates with Keep Connect Rebooter Smart Plugs to trigger power cycles or reboots when speeds fall below user-defined thresholds.
- Free Local Monitoring & Alerts – Enjoy no-cost connection monitoring with email and SMS notifications, ensuring real-time updates on your network status without subscriptions.
- Advanced Cloud Features (Optional) – Upgrade to Keep Connect Cloud Services for remote management, analytics, and consolidated reporting across multiple devices, starting at just $24.99/year.
- Customizable OpenWrt Firmware – Built on OpenWrt for enhanced performance and flexibility, including regular speed tests, heartbeat checks, and both local and cloud-based reporting.
Choosing monitoring by the question you need answered
- “Did a customer-facing endpoint respond?” Use an external uptime check against the relevant storefront or API endpoint.
- “Did running code report an error?” Use application error tracking with the instrumentation and context appropriate to that application.
- “Did this scheduled task check in when expected?” Use a heartbeat monitor that expects the task’s outbound request on its configured cadence.
- “Did the task deliver the right business result?” Add validation or downstream outcome checks; none of the three signals guarantees correctness on its own.
When evaluating monitoring options, check what initiates the signal, how missed runs and timeouts are handled, whether there is a grace period, whether explicit failure and exit-code details are supported, what context an alert includes, and whether the setup requires outbound requests from the task or external endpoint probes. Those are capability questions, not a basis for ranking vendors without a tested comparison.
Quick Recap
Best Value

- Connect up to eight PoE network devices through standard network cables carrying both data and electrical power, including wireless access points, VoIP phones, IP cameras and bridges. Any mix of PoE and non-PoE devices is supported.
- Allocate a 120-watt total PoE budget across eight output ports, with average distribution of 15 watts per port and up to 32 watts maximum per port. Power is delivered through IEEE 802.3at/af-compliant RJ45 ports for connected devices.
- Use eight auto-sensing 10/100/1000 Mbps RJ45 ports to connect computers, servers and network devices, while two RJ45 Gigabit uplink ports connect the switch to additional network infrastructure. Auto-MDIX supports automatic uplink detection.
- Maintain connected PoE device operation with the Powered Device Monitor feature, which restarts a PoE device that fails to respond or send network traffic. This self-healing network function helps restore communication for connected PoE devices.
- Configure manual VLAN mode to isolate ports 1 through 8 from one another, or use manual PoE extend mode to reduce network speed and extend PoE support to 820 feet. Select the operating mode to suit the installation and connected devices.
Rank #4

- Frequent WiFi or monitor disconnections are often caused by router network blockage, which can be fixed by rebooting the device. Rebooting timely frees router memory, optimizes bandwidth efficiency and prevents related network issues. Our timed power-off reboot cable automates this process, eliminating the need for manual intervention to schedule router reboots.
- SANHOOII rebooter cable can connect DC plug to your router adapter, it will power on and start timing automatically, you can press "H" to set the timming time 24/48/72 hour and press "M" to set the power outage duration 10sec/1min/3min. The usual suggestion is to power-off for 1 minute.
- LED Display: Shows current settings so you always know the schedule.
- Plug and play, one step in place, can greatly improve the efficiency of network bandwidth use. You can free your hands now!
- Rebooter cable suitfor CCTV Camera Monitor WiFi Ethernet Switch Network Webcam Moderm and etc.
Product prices and availability are accurate as of the date/time indicated and are subject to change. Any price and availability information displayed on Amazon at the time of purchase will apply.

