Free tools Windows power users keep installed
One-click scans. No signup required.
CPU-Z is a free hardware-information and validation utility from CPUID. It identifies your processor, operating clocks, cache, motherboard, BIOS, memory, timings and graphics adapter, then lets you save or share a configuration or validation record. It is available for Windows and Android.
CPU-Z is not a full-time temperature dashboard. For continuously watching temperatures, voltages and fan speeds, CPUID positions HWMonitor as the companion tool. Use CPU-Z to establish exactly what hardware is installed and how it is configured; use a sensor-focused utility when you need ongoing health readings.
As an Amazon Associate I earn from qualifying purchases.
What CPU-Z does
CPUID describes CPU-Z as “a freeware that gathers information on some of the main devices of your system.” In practical terms, it is a readout and reporting tool for the components that define a PC or Android device’s platform. It can expose details that a basic operating-system summary may omit, including the precise processor model, current clocks, cache hierarchy, motherboard and BIOS data, memory type and timings, and graphics-adapter information.
Recommended Free Tools
The utility is useful when you are diagnosing an unexpected specification, documenting a build, checking whether an upgrade was detected, or preparing a validation record for another person. It reads the system; it does not replace a stability test, a complete performance benchmark, or a permanent sensor-monitoring dashboard.
#1 Best Overall
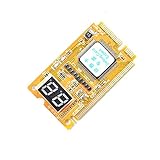
- 3 in 1 tester.
- For PCI, PCI-E, and LPC.
- Diagnostic post-test card.
- Diagnostic post-test card.
- Easy to use.
Which information appears in CPU-Z?
The interface is organized around practical hardware categories. Names and fields can vary slightly by platform, but the following is the information CPU-Z is designed to expose.
| Area | What to look for | Why it matters |
|---|---|---|
| Processor | Processor identity, architecture-related details, reported core and thread information, and operating clocks | Confirms which CPU is installed and whether its current operating behavior matches expectations |
| Cache | Cache hierarchy and the capacities reported for each level | Helps distinguish processor variants and gives software or troubleshooting teams a consistent hardware record |
| Mainboard | Motherboard manufacturer and model, chipset/platform details where reported, and BIOS information | Useful for firmware checks, compatibility questions and identifying an otherwise undocumented board |
| Memory | Memory type, total size, channel-related information where reported, frequency and timing values | Shows whether the installed memory matches the intended capacity and configuration |
| Graphics | Detected graphics adapter information and related operating details | Confirms which adapter the system exposes without opening the case |
| Reports and validation | Saved reports, validation actions and a shareable record of the detected configuration | Creates evidence that another person can inspect instead of relying on a typed specification list |
CPU-Z compared with live sensor monitoring
“Monitoring” can mean two different things. CPU-Z monitors the identity and reported operating state of hardware when you inspect its tabs. It is best understood as an information and validation utility. A live health dashboard continuously tracks temperatures, voltages, fan speeds and similar sensors; that is the role CPUID assigns to HWMonitor.
| Task | CPU-Z | HWMonitor |
|---|---|---|
| Identify CPU, motherboard, RAM and graphics hardware | Primary purpose | Not its primary purpose |
| Show processor clocks and memory timings | Primary use | May expose related sensor readings, but not as the hardware-identification workflow |
| Continuously watch temperatures, voltages and fan speeds | Not a complete sensor-dashboard replacement | Primary purpose |
| Create a hardware or validation record | Supported through report and validation workflows | Not the reason to choose it |
Running both can be sensible: CPU-Z establishes the exact platform and configuration, while HWMonitor supplies the ongoing thermal and electrical view. Do not interpret a CPU-Z hardware readout as proof that a system is cool, electrically safe or stable under sustained load.
The Tool Desk
Outbyte Driver Updater FREEScan for outdated or missing drivers - takes under a minuteDriver Scan →Outbyte PC Repair FREERepair Windows errors before they cause bigger problemsFix Now →Availability and editions
Windows
CPUID provides Windows x86 and x64 downloads. Select the package that matches the operating environment when both choices are offered. Download filenames and version labels can change, so use the current Windows package listed by CPUID rather than relying on an old filename copied from a guide.
Rank #2
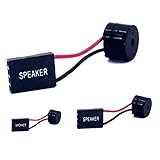
- [Quick PC Diagnostic Tool] Is your new PC build showing a black screen? This motherboard speaker translates silent hardware failures into clear BIOS beep codes. Instantly identify if your RAM, CPU, or GPU is causing the boot failure without guessing.
- [Essential for DIY PC Builders] Modern motherboards often lack built-in audio alerts. Plugging in this mini piezo buzzer before your first boot ensures you hear the satisfying “single beep” of a successful POST, giving builders immediate peace of mind.
- [Universal 4-Pin Header Compatibility] Wondering if it fits your board? It features a standard 4-pin female connector (with 2 active wires) that perfectly matches the “SPEAKER” or “SPK” front panel header on almost all ATX, Micro-ATX, and Mini-ITX motherboards.
- [Clean Wiring & Loud Alarm] Designed with an approx. 3-inch cable, it is long enough to easily plug into the motherboard but short enough to reduce PC case wiring clutter. The premium piezo element delivers a loud, crisp beep that is impossible to miss.
- [Valuable 3-Pack for IT Repair] Includes 3 internal BIOS buzzers in one pack. Perfect for IT technicians keeping spare diagnostic tools in their repair kits, or PC enthusiasts testing multiple rigs. A cost-effective solution to save hours of troubleshooting.
Android
An Android edition is also available. The fields shown depend on what the device and Android expose, so an Android report may not contain every desktop motherboard or BIOS field. Treat missing fields as unavailable on that platform, not automatically as evidence of a defective component.
Portable versus installed use
Choose the distribution CPUID currently offers for your situation. A portable package is convenient for a one-time check or support session; an installed package is easier to keep available on a regularly maintained PC. In either case, obtain the software from CPUID and verify the publisher before running it.
How to check your CPU, motherboard and RAM
The following workflow produces a useful first-pass inventory without opening the case.
- Start CPU-Z. Allow it to finish detecting the platform. If Windows security software asks you to confirm the publisher, verify that the program is from CPUID before proceeding.
- Open the CPU or processor tab. Record the exact processor name, reported core and thread information, and the operating clock values. Clocks can change with power-management settings, so note that the displayed value is a reading at the time of inspection.
- Inspect the Cache tab. Record each reported cache level and capacity. This is particularly useful when two processor models have similar marketing names.
- Open the Mainboard tab. Capture the board manufacturer, model, platform or chipset information shown, and BIOS vendor, version and date when available. These details are more reliable for firmware research than a generic “desktop PC” label.
- Open the Memory tab. Check the memory type, total size, channel information where present, operating frequency and primary timings. Compare the total with the amount you installed and compare the operating values with the profile or specification you intended to use.
- Inspect the graphics section. Confirm that the expected graphics adapter is detected. On systems with multiple adapters, note which entries the utility exposes instead of assuming that the first name is the active display device.
- Save or share a report. Use CPU-Z’s report function when you need a reproducible inventory for a support ticket, upgrade decision or personal records. Include the date and any relevant power or performance setting in your own notes.
A screenshot can show a single tab, but a saved report is generally more useful when another person must review several categories or compare the machine before and after a change.
Rank #3

- 【1】*** MUST see the 3rd pictures in listing that highlights the correct PCI slots to work ***. Using this kit wrongly on motherboard other PCIe port is not the reason of "Doesn't Work". Please make sure the motherboard has PCI slot before placing the order. The Large Desktop PC motherboard diagnostic card is NOT a PCIe card but a Standard PCI card. If the PC has PCIe express slots only, please see my other listing with the "V8 PCIe Diagnostic Kit" instead. ***DO NOT push the Wrong pins with excess force to avoid issue. MUST MAKE SURE PSU 4 / 6 / 8 pin power connector pins match and fit to the tester exact same 4, 6, 8 pins CORRECTLY although the PSU tester is fault tolerant and preventive.
- 【2】This starter kit comes with 1 large PCI test board and 1 small laptop test board for the old desktop PCs and old laptops diagnosis respectively. The large test board comes with【BIOS SPEAKER】to get the desktop PC motherboard Bios beep codes. The 【motherboard power switch cable】is nice to quick check the sticky or damaged PC motherboard power switch button and cable causing no power ON issue. The【the Anti Static Wrist Strap】is a plus to help discharge static during the PC repairs. The 【ATX PSU tester】in this kit is either Blue or Black Color with EXACT same features to quick test the 20/24 pins PC ATX PSUs.
- 【3】Nice starter kit for old computers no Power On / Auto Power OFF / no POST / no Display / no Boot ...etc. diagnosis. No need to swap Known Good Parts in the computer repairs. Save time and money!! All parts are packed well and stored neatly in a nice 【Portable Carrying Storage Case】. A overall great starter kit to add to our tool boxes! Great for computer class learning and old PCs quick troubleshooting needs as well.
- 【4】Please see the listing for the instruction PDFs. *****【On the listing page】, scroll down to after the "Product Information" table the "Product guides and documents" section, BOTH the pictorial "User Guide (PDF)" and the "User Manual (PDF)" are needed. *****. ***** Besides, please DO NOT discard the ITEM PACKING Included Paper Manual Note Printout since that also contains the complete Instruction folder info!!! *****
- 【5】Online Easy Guide and Pictorial Manuals to guide step by step with complete list of codes description. Downloadable manuals to stay updated. Welcome to conact if any question or need helps. Quality Genuine Computer Hardware Diagnostic Test Starter Kit with Free Lifetime Customer Service Supports from 29 years professional computer hardware work experienced seller.
How to interpret clocks and memory timings
Processor clocks
The displayed operating clock is a point-in-time observation. Modern processors adjust frequency according to workload, temperature, power limits and firmware policy. A lower value while the system is idle does not by itself indicate a fault, and a higher short-lived value does not prove that the processor can sustain it indefinitely.
For troubleshooting, take several observations under comparable conditions: idle, a known workload and immediately after the workload. Record the power plan or firmware mode if it is relevant. CPU-Z can tell you what the system is reporting, but it cannot establish long-term stability or thermal safety on its own.
Memory frequency and effective data rate
Memory utilities may report a clock value that is not written in the same form as the memory’s advertised effective data rate. Compare like with like when checking a specification. Also inspect capacity, channel configuration and timings together; a correct total capacity with an unexpected channel mode can explain a performance or compatibility concern.
Do these 3 things before closing this tab:
1Scan for outdated or missing drivers - takes under a minute2Repair Windows errors before they cause bigger problems3Fix the driver behind crashes, sound loss and screen glitchesUsing CPU-Z to document an overclock
CPU-Z is useful for documenting an overclock because it exposes the processor identity, operating clocks, cache and memory settings in one place. It should be treated as an observation and validation record, not as a complete overclocking safety certificate.
Rank #4

- CEL Doctor: The ANCEL AD310 is one of the best-selling OBD II scanners on the market and is recommended by Scotty Kilmer, a YouTuber and auto mechanic. It can easily determine the cause of the check engine light coming on. After repairing the vehicle's problems, it can quickly read and clear diagnostic trouble codes of emission system, read live data & hard memory data, view freeze frame, I/M monitor readiness and collect vehicle information
- Sturdy and Compact: Equipped with a 2.5 foot cable made of very thick, flexible insulation. It is important to have a sturdy scanner as it can easily fall to the ground when working in a car. The AD310 OBD2 scanner is a well-constructed mechanic tool with a sleek design. It weighs 12 ounces and measures 8.9 x 6.9 x 1.4 inches. Thanks to its compact design and light weight, transporting the device is not a problem. The buttons are clearly labelled and the screen is large and displays results clearly
- Accurate Fast and Easy to Use: The AD310 scanner can help you or your mechanic understand if your car is in good condition, provides exceptionally accurate and fast results, reads and clears engine trouble emission codes in seconds after you fixed the problem. This device will let you know immediately and fix the problem right away without any car knowledge. No need for batteries or a charger, get power directly from the OBDII Data Link Connector in your vehicle
- OBDII Protocols and Car Compatibility: Many cheap scan tools do not really support all OBD2 protocols. AD310 scanner as it can support all OBDII protocols such as KWP2000, J1850 VPW, ISO9141, J1850 PWM and CAN. This device also has extensive vehicle compatibility with 1996 US-based, 2000 EU-based and Asian cars, light trucks, SUVs, as well as newer OBD2 and CAN vehicles both domestic and foreign. Pls confirm with our customer service whether it is compatible with your vehicle before purchasing
- Home Necessity and Worthy to Own: This is an excellent code reader to travel or home with as it weighs less and it is compact in design. You can easily slide it in your backpack as you head to the garage, or put it on the dashboard, this will be a great fit for you. The AD310 is not only portable, but also accurate and fast in performance. Moreover, it covers various car brands and is suitable for people who just need a code reader to check their car
- Record the baseline. Before changing firmware settings, save a CPU-Z report showing the stock processor, clock behavior, cache, motherboard and memory values.
- Apply one controlled change. Change the intended firmware setting, such as a multiplier, frequency or memory profile, and keep a note of the exact value.
- Boot and inspect the CPU tab. Confirm that the processor is recognized correctly and that the reported operating clock reflects the change under the same workload used for the baseline.
- Inspect memory values. If the change involved memory, check capacity, channel information, frequency and timings rather than looking only at one frequency field.
- Save a second report or validation record. Include the firmware version and date, the setting changed, and the observation conditions.
- Perform a separate stability and thermal check. Use an appropriate sustained workload and a sensor-monitoring tool. CPU-Z’s record can show what was configured; it does not by itself prove that the system remains stable or within safe temperatures.
If the machine crashes, resets or reports inconsistent values, return to the last known-good configuration, verify firmware settings and repeat the comparison with only one change at a time. A validation file is most useful when it is paired with those notes rather than presented as a guarantee.
Independent reader supportYour contribution helps us test, update, and keep practical guides available for everyone.Reports, validation and cache-latency tools
Configuration reports
A report gathers the detected categories into a form that can be saved or shared. This is valuable for remote support: the recipient can see the processor, board, memory and graphics information without asking you to transcribe every field. Keep a dated baseline before replacing a motherboard, updating firmware or changing a memory configuration.
Validation workflow
CPU-Z documents a validation-file workflow for recording a system state and sharing the result. Use it when you need an auditable snapshot of the configuration or a way to compare two states. A validation result still describes the machine at the time it was created; it is not a permanent guarantee that later settings, firmware or hardware are unchanged.
What’s actually slowing this PC down?
Pick the symptom - the matching free tool is one click away.
Cache-latency computation
CPUID also documents a cache-latency computation tool. It is suited to investigating memory and cache behavior alongside the identity and timing data shown in the main tabs. Treat any latency figure as a measurement under its stated conditions, not as a universal score that can be compared across every processor, firmware mode and workload.
Best Value

- [Standard Interface] This pc diagnostic card features standard pci and isa interfaces, making it easy to access desktop pcs.
- Post Code Display] With a 4 digit display, the card shows the current and previous error codes, aiding in troubleshooting.
- [Compatibility] Compatible with all motherboards with pci and isa bus slots, this diagnostic card is suitable for a wide range of computers.
- [Hexadecimal Display] The card's dot hexadecimal readout displays accurate power on self test (post) status codes, providing detailed diagnostic information.
- [Remote Display Function] The motherboard diagnostic card comes with a self-checking remote display function for easy viewing of post codes.
Troubleshooting with CPU-Z
The installed RAM is lower than expected
- Check the total memory value in the Memory tab.
- Inspect channel information and compare the module arrangement with the motherboard’s intended slots.
- Check whether the operating system, firmware or integrated graphics reserves part of the capacity.
- Power down and reseat modules only after recording the current configuration, then compare the new report with the baseline.
The processor clock looks wrong
- Observe the value at idle and during a repeatable workload; do not judge from one idle reading.
- Check firmware power, boost or overclock settings.
- Compare the processor name and reported core/thread information with the system you intended to build.
- Use a live sensor utility for temperature and voltage context, because CPU-Z alone is not a complete health monitor.
The motherboard or BIOS is not identified as expected
- Check the Mainboard tab for the exact manufacturer and model fields rather than relying on a computer name in the operating system.
- Record the BIOS vendor, version and date when they are available.
- If fields are blank or generic, compare with the physical board label or firmware setup; platform-specific reporting limitations can prevent CPU-Z from displaying every value.
A report differs after an upgrade
Compare the old and new reports category by category. A changed BIOS version can alter memory timings or clock behavior even when the physical components are unchanged. Save both files with dates and a short note describing what was replaced or reconfigured.
Limits and sensible precautions
- CPU-Z reports what the platform exposes; it cannot identify information that firmware or the operating system does not make available.
- Clock readings are dynamic and can vary with workload, power policy and firmware.
- A hardware inventory is not a benchmark, a burn-in test, a temperature log or proof of overclock stability.
- For a complete thermal, voltage and fan-speed view, use the sensor-focused companion utility rather than treating CPU-Z as a continuous dashboard.
- Version numbers and download filenames are volatile. Confirm the current CPUID download and validation service before installing or citing a release.
Current validation release context
CPUID’s official site listed “CPU-Z Validation V3” as version 3.01, dated August 20, 2026. Because validation services and download labels can change, treat that listing as a dated release reference and re-check CPUID’s current page when you publish a guide, document a support case or compare results.
For developers: embedding hardware detection
Software developers who need hardware detection inside their own Windows or Android product can investigate the CPUID System Information Development Kit. CPUID describes it as making the CPU-Z detection engine available for customized use on those platforms. The SDK is a developer integration option, not a consumer edition of the desktop utility. Commercial licensing, redistribution rights and current technical terms require direct verification with CPUID.
A practical decision guide
| Your question | Use CPU-Z? | What to do |
|---|---|---|
| What exact CPU, cache, motherboard, RAM or graphics adapter is installed? | Yes | Review the relevant identification tab and save a report. |
| Are the current processor clocks or memory timings what I expected? | Yes, for an observation | Compare readings under repeatable conditions and note firmware settings. |
| What are my current temperatures, voltages and fan speeds? | Not as the primary tool | Use a live sensor-monitoring utility such as HWMonitor. |
| Is my overclock stable for sustained use? | Only partly | Use CPU-Z to document settings, then run separate stability and thermal checks. |
| Can I embed this detection capability in my own application? | Not with the consumer interface | Review the CPUID System Information Development Kit and verify its terms directly. |
Bottom line
CPU-Z is the right first tool when you need a precise, shareable inventory of a computer’s processor, clocks, cache, motherboard, memory and graphics hardware. Its reports and validation workflow make it especially useful for upgrades, support and overclock documentation. Pair it with a dedicated sensor monitor for continuous temperatures, voltages and fan speeds, and use separate stability testing before treating any overclock as ready for everyday work.
Quick Recap
Product prices and availability are accurate as of the date/time indicated and are subject to change. Any price and availability information displayed on Amazon at the time of purchase will apply.

