What’s actually slowing this PC down?
Pick the symptom - the matching free tool is one click away.
Cloud-scale real-time monitoring is a pipeline, not a dashboard: instrument applications and infrastructure, collect and route their telemetry, store and query each signal, then connect what you learn to operators or automation. The right design depends on the workload, deployment footprint, and how quickly people or systems need to act; there is no universal latency, retention, or sampling setting.
What flows through a monitoring architecture?
A useful starting model is applications and infrastructure → instrumentation and exporters → collectors → processing and routing → storage → queries and visualization → alerts, operators, and automation. Each stage has a distinct job. If a stage is missing or overloaded, a dashboard alone cannot make the system observable.
As an Amazon Associate I earn from qualifying purchases.
Cloud-native systems produce three complementary kinds of telemetry. Metrics summarize measurements over time, logs record timestamped messages or events, and traces show a request’s path through services. Kubernetes describes these signals and their separate collection and analysis flows in its observability documentation.
| Signal | What it helps answer | Typical role in diagnosis |
|---|---|---|
| Metrics | How a measurement changes over time | Spot service or infrastructure symptoms and trends |
| Logs | What messages or events were recorded, and when | Inspect relevant events around a symptom |
| Traces | Which services handled a request and how its path unfolded | Locate a slow or failing part of a distributed request |
These signals are related, not interchangeable. A metric can show that a service’s error rate rose; a trace can locate the failing part of a request path; relevant logs can supply event detail. Correlation is most useful when teams can move from a symptom to the corresponding requests and events, rather than treating each backend as an isolated island.
#1 Best Overall
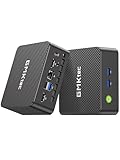
- 12th Intel Alder Lake N95 Processor – The GMKtec G3 S Mini PC is powered by the 12th Gen Intel N95 processor with 4 cores, 4 threads, 6MB cache and a burst frequency up to 3.4GHz. Compared with N100/N5105/N5100/N5095, the N95 delivers up to 36% overall performance improvement. Perfect for routine tasks, office work, and home entertainment, this compact mini desktop is more convenient than traditional bulky PCs.
- 8GB RAM & 256GB SSD Storage – Pre-installed with 8GB DDR4 memory and a fast 256GB M.2 2242 SSD, the G3 S mini desktop offers quicker startup, smoother multitasking, and faster file transfers. Enjoy seamless performance whether you’re working on multiple applications, browsing, or streaming content.
- Rich Interfaces & Connectivity – The G3 S mini computer comes equipped with USB 3.2 (up to 10Gbps), dual HDMI 2.0 (4K@60Hz), and a 3.5mm audio jack. With support for WiFi 5, Bluetooth 5.0, and Gigabit Ethernet (RJ45 1000MbE), it connects easily with monitors, projectors, printers, office equipment, and other peripherals, making it versatile for both home and business use.
- Dual 4K Display Support – Featuring upgraded Intel UHD Graphics (up to 1000MHz), the G3 S supports 4K video playback and AV1 decoding for a smooth viewing experience. With dual HDMI outputs, you can connect two 4K@60Hz displays simultaneously, enabling efficient multitasking for work and entertainment.
- GMKTEC WARRANTY - GMKtec offers a 3-year limited warranty (1 year replacement + 2 years parts replacement) for each mini PC, starting from the date of the purchase effective on all sales starting Oct. 2026. All defects due to design and workmanship are covered. With a professional after sales team always ready to attend to your needs, you can simply relax and enjoy your mini PC
How should telemetry be collected and routed?
Instrumentation creates telemetry in applications and exposes or exports measurements from infrastructure. Collection then moves that data toward processing and storage. The collection mechanism should match the signal and platform: a scrape model may suit metrics endpoints, while agents or exporters can collect and forward logs or traces. Avoid assuming that one mechanism collects every signal in every environment.
Use OpenTelemetry to standardize instrumentation and collection
OpenTelemetry is a vendor-neutral framework for instrumenting, generating, collecting, and exporting telemetry. Its Collector can receive, process, and export signals, providing a place to apply shared pipeline conventions before data reaches a backend. This can reduce dependence on backend-specific instrumentation, but it does not guarantee identical backend behavior or a cost-free migration.
The OpenTelemetry project overview states, “You own the data that you generate. There’s no vendor lock-in.” That is a project principle, not a promise that every implementation has zero switching costs. The project’s documentation page reported support from more than 90 vendors and showed a modification date of August 29, 2025; that is a dated documentation figure, not a verified 2026 count. See the OpenTelemetry documentation.
Quick wins for a faster PC:
Clear out junk files and repair common Windows errorsFree Scan →Scan for outdated or missing drivers - takes under a minuteDriver Scan →Rank #2

- 【AMD Ryzen 3 5300U CPU: Outperforms N150 & 3500U】 BOSGAME E5 mini PC is powered by the TSMC 7nm FinFET architecture AMD Ryzen 3 5300U processor (4 Cores, 8 Threads, up to 3.8GHz boost, 6MB total cache). Compared to low-end Intel N150 or 3500U chips which only have 4 single threads and throttle under load, the 5300U delivers over 30% faster multi-core speed. Run 30+ browser tabs, large Excel sheets, and Zoom meetings simultaneously without system lag.
- 【8GB DDR4 RAM & 256GB NVMe SSD Storage】 Installed with high-speed 8GB DDR4 dual-channel memory and a fast 256GB M.2 2280 SSD, eliminating slow boot times and application loading delays. To accommodate growing data requirements, the upgradeable hardware design features dual SODIMM slots that allow you to expand memory up to 64GB RAM, ensuring smooth operation during heavy multitasking.
- 【High-Capacity Dual M.2 SSD Storage Expansion】 Never worry about running out of space for your business files. In addition to the pre-installed 256GB system drive, the motherboard houses an extra empty internal M.2 2280 NVMe PCIe 3.0 slot. This allows you to easily add a second solid-state drive for up to an additional 2TB of storage capacity (upgrades not included) without needing to remove or reinstall the original operating system.
- 【Radeon 6-Core Graphics & Triple 4K Displays】 Integrated with official AMD Radeon Graphics (6 Graphics Cores, 1500 MHz frequency) for casual gaming, photo editing, and crisp 4K media decoding. Featuring 1x HDMI 2.0 port, 1x DisplayPort, and 1x Full-Function Type-C port, the E5 outputs true 4K@60Hz resolution to three monitors at once. This multi-screen setup eliminates constant window-switching for traders, programmers, and office workers.
- 【Dual 2.5GbE LAN Ports for Advanced Networking】 Experience fast wired network transmission speeds up to 2500Mbps without lagging or buffering. The integration of dual 2.5 Gigabit Ethernet ports (powered by Realtek RTL8125 controller) makes this compact computer an exceptional hardware choice for tech enthusiasts. Easily configure it into software routers, hardware firewalls (pfSense, OpnSense), home NAS servers, or local homelabs.
Keep Kubernetes signal paths distinct
Kubernetes documentation gives concrete patterns rather than a single collector for everything: scrape component metrics endpoints into time-series storage; collect node and control-plane logs and centralize them; and forward spans through an OpenTelemetry Collector to a tracing backend. Not every cluster or component exposes the same signals, so the implementation must fit the actual environment. For multi-cluster or multicloud metrics visibility, distributed time-series systems such as Thanos or Cortex can complement Prometheus.
Where should processing and storage happen?
Processing may happen near workloads, centrally, or at both points. Near-workload processing can filter, enrich, redact, or sample telemetry before it leaves a cluster. Central processing can apply shared routing and conventions across clusters. Choose placement by balancing local control and data handling against consistency and operational complexity; avoid sending data to a central point without considering what happens when that path is unavailable.
Storage should fit the signal and the questions teams need to ask. Metrics, logs, and traces may use separate purpose-built backends, or a managed service may integrate some of those functions. Compare options by query patterns, operational ownership, data-handling requirements, portability, and the work of maintaining the pipeline—not by dashboard appearance alone. Google’s guidance for hybrid and multicloud monitoring and logging patterns includes managed and distributed deployment considerations, including Google Cloud Observability as one example rather than a required design.
Rank #3

- 【MAX 7735U High Performance 】Powered by the AMD Ryzen 7 7735U (8-Core, 16-Thread, boost up to 4.75GHz), this Beelink SER5 MAX mini PC delivers robust performance for daily office tasks, including spreadsheet editing, PPT creation, email management, coding and web browsing. It effortlessly handles photo and video editing via PS, PR and Lightroom, and runs popular esports titles such as LoL, CSGO and DOTA 2 at excellent settings.
- 【High‑Speed Memory & Storage】 Equipped with 24GB high-speed LPDDR5 RAM and a blazing-fast 500GB M.2 2280 PCIe 4.0 SSD, this BEELINK 7735U MINI PC supports seamless heavy multitasking. It features expandable storage up to 8TB, letting you store massive project archives and local files without worry.
- 【4K Triple Display & Radeon 680M Graphics】 Built-in AMD Radeon 680M Graphics (12-Core, 2200MHz) brings outstanding graphic performance for design work and buttery-smooth 4K HDR video playback. This BEELINK SER5 MINI PC supports triple 4K monitors via HDMI, DP and USB-C port, allowing you to run trading dashboards, spreadsheets and design drafts side-by-side to boost your productivity.
- 【Cooling & Full Connectivity】 This BEELINK SER5 7735U MINI PC adopts an upgraded dual‑cooling system with heatsink and cooling fan that boosts heat dissipation by 19% while keeping noise below 32dB for quiet operation. Equipped with WiFi 6, Bluetooth 5.4 and 2.5G RJ45 Ethernet port, it delivers stable, lag‑free connections ideal for office work, home media and home‑server use.
- 【Lifetime Technical Support】Ryzen 7 mini pc Package Included:1* Beelink Ser5 7735U Mini PC,1* HDMI Cables( 100cm),1* Power adapter,1* User manual,1* Mounting bracket.If you want to set up automatic startup,please contact us.All of our mini pc obtained FCC,CE ROSH Certifications.We Offer 1 Year Free Warranty,and 7 Days/24 Hours Serving,and lifetime technical issue assistance without worrying about quality,just email to our customer service team.
There is no universal retention period, sampling rate, cardinality limit, throughput target, or cost configuration established by these architecture sources. Set them from the workload’s signal volume, investigation needs, query patterns, and storage and processing costs. Review the effect of those choices on the ability to diagnose incidents before treating a lower-volume pipeline as a better one.
The Tool Desk
Outbyte PC Repair FREERepair Windows errors before they cause bigger problemsFix Now →Outbyte Driver Updater FREEFix the driver behind crashes, sound loss and screen glitchesFind Drivers →How does the design change as clusters and services grow?
Growth changes more than ingestion volume. A design that works for one service may need stronger failure isolation, shared routing conventions, and a way to compare service health across regions or clusters. Google Cloud’s scalable and resilient application guidance cautions that a single metric is unlikely to determine whether a service is unhealthy or should scale.
- Deployment scope: Decide whether visibility is limited to one service or cluster, or spans multiple clusters, regions, or clouds. Multi-cluster views need consistent signal names and labels if comparisons are to be useful.
- Failure isolation: Consider whether a collector, network path, or backend outage could interrupt telemetry from every workload. Plan for buffering and backpressure where needed, and decide what monitoring remains available during an outage.
- Workload context: Interpret a signal alongside relevant service and infrastructure context. A metric change alone may not explain the cause of a fault or whether scaling is the right response.
- Operational action: Define which signals inform a human, which trigger an alert, and which may drive automation such as autoscaling. The action should match the confidence and purpose of the signal.
What does “real time” need to mean operationally?
“Real time” is not a fixed latency guarantee in the cited architecture guidance. It is a freshness target for a particular operational decision: how old can the telemetry be before an alert, diagnosis, or automated response is no longer useful? Set that target for the workload and action, then account for collection intervals, processing, network delivery, backend ingestion, and query or alert evaluation. A pipeline can be technically functioning while its data arrives too late for the decision it is meant to support.
Rank #4

- MINI PC COMPUTER OFFICE LIGHT GAMING - GMKtec Nucbox G10 Series is equipped with the Ryzen 5 3500U, a 64-bit quad-core mid-range performance x86 mobile microprocessor. This processor is based on AMD's Zen+ microarchitecture and is fabricated on a 12 nm process. The 3500U operates at a base frequency of 2.1 GHz with a TDP of 15 W and a Boost frequency of 3.7 GHz. This APU supports up to 32 GB of dual-channel DDR4-2400 memory and incorporates Radeon Vega 8 Graphics operating at up to 1.2 GHz. 20% Multi-core Performance increase over previous Ryzen 3 models such as 4300U. 35% performance increase over the Intel N-series N95/N97/N150.
- RYZEN 5 3500U vs RYZEN 3 4300U COMPARISON - Why Choose Ryzen 5 3500U: Better multi-threaded performance: More threads, better suited for multitasking and demanding applications. Better graphics: With Vega 8, it's superior for casual gaming, video playback, and GPU-intensive tasks. Overall higher performance: Higher boost clock and better ability to handle a variety of workloads, from light gaming to productivity tasks. So, if you're looking for a more balanced processor with stronger multitasking capabilities and better GPU performance, the Ryzen 5 3500U would be the clear choice.
- 16GB DUAL CHANNEL DDR4 + 512GB SSD - Installed with DDR4 16GB SO-DIMM RAM Dual Channel (2x8GB) and a 512GB SSD, the Nucbox G10 mini pc supports memory expansion to 64GB RAM. Featured with Dual M.2 2280 PCIe 3.0 slots, supports dual storage slot expansion to 16TB SSD (2*8TB). (Upgrades not included) This model supports a configurable TDP-down of 12 W and TDP-up of 35 W.
- UNLEASH RAW PERFORMANCE MODE 25W - Dominate demanding tasks with the AMD Ryzen 5 3500U processor. When switched to Performance Mode in the BIOS (press "Esc" key repeatedly during boot, save then exit), this mini PC delivers superior multi-core processing power, significantly outperforming Intel N-series chips in CPU-intensive applications, multitasking, and creative workloads.
- MINI DESKTOP COMPUTER WITH TRIPLE DISPLAY SCREEN - Nucbox G10 integrates AMD Radeon Vega 8 1200 MHz GPU to deliver powerful graphics processing power to easily handle video editing, and playback, or casual gaming. And it can connect to 3 display screens simultaneously via HDMI 2.1 TMDS/ DPv1.4/ TYPE-C.
Make the target explicit and verify it across the whole path, rather than equating a fast dashboard refresh with fresh underlying data. Different signals and actions may justify different freshness targets; the sources do not prescribe one universal bound.
How can teams put the architecture into practice?
- Start with decisions. List the failures, degradations, or capacity questions operators must detect, investigate, or act on. Identify the audience and the response expected for each.
- Map the telemetry. For each service and infrastructure component, determine which metrics, logs, and traces it can provide and how those signals are exposed or exported.
- Choose collection paths. Select scrape, exporter, agent, or Collector patterns according to the signal and platform. For Kubernetes, keep metrics, logs, and traces on the paths appropriate to each signal.
- Define processing and routing. Decide where filtering, enrichment, sampling, redaction, and routing occur, and consider how the pipeline behaves under backpressure or component failure.
- Select storage and queries. Match backends to signal type and investigation needs. Establish retention and cost decisions from expected volume and useful query windows rather than relying on generic thresholds.
- Connect to operations. Build dashboards and alerts around the decisions identified at the start. Specify escalation ownership and whether any signal is permitted to trigger automation.
- Validate the end-to-end path. Confirm that telemetry reaches the intended backend, can be queried with useful context, and arrives within the workload’s freshness target—including when parts of the pipeline are degraded.
The resulting design is a set of explicit trade-offs: how much telemetry to collect, where to process it, how to store and query it, and what operational action it can safely support. Document those choices so that service teams can extend the system without silently changing the meaning or availability of its signals.
Quick Recap
Product prices and availability are accurate as of the date/time indicated and are subject to change. Any price and availability information displayed on Amazon at the time of purchase will apply.

