Recommended Free Tools
Neither cloud GPUs nor on-premises GPUs are universally faster or cheaper. The better choice depends on your training workload, expected accelerator utilization, cluster size, data movement, capacity deadlines, operational skills and complete lifecycle cost. Foundation-model pretraining often favors large, tightly connected clusters that can run for weeks or months; intermittent fine-tuning and smaller experiments may benefit from elastic cloud capacity. The only dependable comparison is a benchmark of your model and data pipeline on viable systems, followed by a cost calculation that includes every hour and dependency required to finish the run.
Start with the decision you actually need to make
Choose cloud GPUs when you need capacity quickly, workloads vary sharply, or buying and operating a cluster would leave expensive hardware idle. Choose on-premises GPUs when you can keep a known configuration busy, have suitable power and cooling, need predictable access to the machines, or face data-handling constraints that make local deployment preferable. A hybrid design can be sensible when development and burst capacity are in the cloud while steady production training runs on owned hardware.

As an Amazon Associate I earn from qualifying purchases.
This is a capacity and system decision, not a comparison of two GPU model names. A training run can be limited by high-bandwidth memory (HBM), GPU-to-GPU links, host memory, storage throughput, network latency, input preparation or checkpointing long before the arithmetic units reach their theoretical peak. Google Cloud describes foundation-model pretraining as requiring high accelerator throughput, substantial HBM and fast interconnects; those are properties of the complete platform, not proof that a particular cloud instance will beat an on-premises server.
The Tool Desk
Outbyte PC Repair FREERepair Windows errors before they cause bigger problemsFix Now →Outbyte Driver Updater FREEFix the driver behind crashes, sound loss and screen glitchesFind Drivers →Match the platform to the workload
Foundation-model pretraining
Pretraining a large model on a massive corpus can require many accelerators operating continuously for weeks or months. The dominant risks are obtaining a large enough cluster, keeping all workers synchronized, feeding data fast enough and recovering from failures without losing substantial progress. Accelerator-optimized machine types and a cluster orchestrator are common recommendations for this class of deployment in Google Cloud documentation, but the same architectural requirements must be evaluated on an owned cluster.
- Capacity: You may need dozens or hundreds of GPUs at once, not merely one available GPU.
- Interconnect: Collective operations such as all-reduce depend on GPU-to-GPU links and the network fabric.
- Checkpointing: The training system must write and restore checkpoints reliably so a failed worker does not erase days of work.
- Scheduling: A delayed or interrupted allocation can affect the project schedule even when its nominal hourly price is low.
Fine-tuning and evaluation
Fine-tuning a pretrained model, running parameter-efficient adaptation or evaluating checkpoints generally uses less compute than foundation-model pretraining. Jobs may last minutes, hours or a few days and can arrive in bursts. Elastic cloud capacity, including interruptible instances when the job can resume safely, often has practical value. An owned GPU can still win when the same machine is used continuously for many runs and data remains on a local high-speed storage system.
Development, experimentation and small jobs
Interactive notebooks, ablation studies and hyperparameter sweeps often have uneven utilization. Paying only while a machine is running avoids buying capacity that sits idle between experiments. Conversely, repeated daily use by a team can make a small on-premises workstation or server economical if staff can maintain it and the workload does not need a larger multi-node fabric.
What a meaningful benchmark must specify
A benchmark that reports only “GPU X trained model Y faster” is not reproducible or useful for a purchase decision. Record the complete configuration in the same report as the result.
Do these 3 things before closing this tab:
1Fix the driver behind crashes, sound loss and screen glitches2Repair Windows errors before they cause bigger problems3Scan for outdated or missing drivers - takes under a minute| Benchmark dimension | What to record | Why it changes the result |
|---|---|---|
| Model and data | Model architecture and parameter count, sequence length or image resolution, batch and microbatch sizes, optimizer, precision, dataset size, preprocessing and augmentation | These determine arithmetic intensity, memory pressure and input volume. |
| Accelerators | GPU model, count, HBM capacity, clock or power mode and whether the run is single-node or multi-node | The same nominal GPU can behave differently when memory or power limits change. |
| Interconnect and network | GPU-to-GPU topology, NVLink or equivalent links, host PCIe layout, fabric speed, topology across nodes and collective-communication settings | Synchronization overhead can dominate scaling efficiency. |
| Storage and data path | Dataset location, filesystem or object store, cache policy, read and write throughput, checkpoint destination and preprocessing workers | Starved GPUs show low utilization even when compute is sufficient. |
| Software | Framework and version, CUDA or driver version, distributed-training library, compiler settings and container image | Kernel selection and communication libraries can materially alter throughput. |
| Operational state | Warm-up policy, checkpoint frequency, failures, queue time, idle periods and whether other jobs share the system | Elapsed project time and usable capacity are not the same as kernel speed. |
Measure the metrics that answer the business question
Report both system performance and economics. A useful minimum set is:
- Training throughput: samples per second, tokens per second or images per second, using a clearly defined steady-state interval.
- Time to completion: wall-clock time for the full run, including startup, data staging, evaluation and checkpoint writes.
- Scaling efficiency: throughput at one, two, four and more GPUs divided by the ideal linear increase.
- Throughput per accelerator: total throughput divided by the number of GPUs, which exposes whether adding GPUs creates useful work or communication overhead.
- Cost-normalized throughput: completed samples or tokens per currency unit, using the actual effective rate and all required services.
- Model FLOPs utilization (MFU): observed model computation compared with theoretical compute. Google Cloud recommends it as one diagnostic, while warning that “You can’t rely solely on conventional resource-efficiency metrics like model FLOPs utilization (MFU).”
- Data-path metrics: storage read bandwidth, input-queue wait time, preprocessing CPU utilization, network utilization and checkpoint duration.
- Reliability metrics: interruption count, recovery time, failed-job waste and the percentage of allocated time spent doing useful training.
MFU can look healthy while a job still misses its deadline because storage I/O, evaluation, synchronization or checkpointing is slow. Conversely, a lower MFU may be acceptable if the platform completes the run sooner at a lower total cost.
A repeatable benchmark procedure
- Define the training target. Specify the exact model revision, dataset snapshot, number of training tokens or examples, convergence criterion, precision and maximum acceptable completion time.
- Build identical software environments. Use the same framework, library versions, container, compiler flags, random-seed policy and data preprocessing code on each platform.
- Stage representative data. Test the real storage path rather than a synthetic in-memory dataset. Measure cold-cache and warm-cache behavior if production can experience both.
- Warm up and calibrate. Exclude startup compilation from steady-state throughput, but report it separately because it affects short jobs. Verify that batch sizes fit in memory without hidden gradient accumulation changes.
- Run single-accelerator and single-node tests. Capture throughput, memory use, input wait time and checkpoint speed. This establishes a baseline before distributed overhead is introduced.
- Run multi-accelerator tests. Use the same global batch size and optimization settings, then test the GPU counts you would actually deploy. Record scaling efficiency and collective-communication time.
- Test failure recovery. For interruptible cloud capacity, deliberately terminate a worker or simulate an equivalent failure. Measure lost work, restart time and checkpoint integrity.
- Repeat enough times to show variability. Report median and range for cloud runs, queue or allocation delays, and any noisy-neighbor or thermal effects on owned hardware.
- Convert results into a completed-run estimate. Multiply measured wall-clock requirements by the effective hourly cost, then add storage, data transfer, orchestration, support and expected failed-run waste.
Cloud GPU capacity, billing and operational trade-offs
On-demand capacity
On-demand instances are the simplest baseline: you request capacity and pay an hourly rate while it runs. The rate is easy to model, but availability is not guaranteed in every region or GPU type. Include time spent waiting for allocation and any data-staging charges in a deadline-sensitive plan.
Reservations and committed capacity
Reservations can provide capacity assurance for planned training windows. A lower effective rate may require a commitment, minimum spend or a fixed term. Compare the commitment with your forecast utilization; unused reserved time is an economic cost even if the nominal GPU rate is attractive.
Rank #2

- Part number 900-53651-2500-000 and model: P3651
- This is the 2 slot version for when there is no empty slots between 2 slot cards. If you have one or more empty slots between the cards or the cards are 3 slot this NVLink will not work. See the attached images showing the card layout.
- NVLink 3.0 for any brand of RTX Ampere model graphics cards: 3090, A30, A40, A100 / H100 (Requires three NVLinks), A800, A4500, A5000, A5500, A6000
- This is the same as PNY part number: NVLAMP-2SLOT-BSP and RTXA6000NVLINK-KIT
- This is the same as Dell part number: 0RWJ7Y
Spot or preemptible capacity
Spot VMs use unused capacity and may be preempted at any time. Google Cloud recommends them for stateless workloads that can fail gracefully. They can reduce the price of restartable fine-tuning or batch jobs, but a pretraining run that loses hours of work may cost more in elapsed time and engineering effort than it saves in hourly charges. Your benchmark should include checkpoint frequency, restart time and interruption probability rather than treating the spot rate as the complete cost.
Cloud system services
Large jobs also consume object storage, high-performance filesystems, data egress or transfer, logging, orchestration and sometimes managed cluster-control services. These items can be small relative to GPU charges for a long run, or dominant for short experiments that repeatedly move large datasets. State the region, currency, tax treatment, pricing date and commitment assumptions in every estimate.
On-premises GPU requirements and continuing obligations
Buying a server converts an hourly cloud charge into a capital asset plus recurring operating work. A credible model includes the GPU server, networking, racks, power distribution, cooling, storage, backup, software support, facilities, administrator time, maintenance, warranty, spare parts, security controls and refresh or resale assumptions. If the cluster is idle between projects, allocate that idle period to the cost of each completed run.
Power and cooling
Use measured or quoted facility draw rather than GPU board power alone. Servers, CPUs, memory, fans, switches and storage all consume power, and cooling adds overhead. Confirm that the site can deliver the required electrical capacity continuously; a server that cannot run at its rated configuration is not equivalent to a cloud instance.
Networking and storage
Multi-node training may require a low-latency fabric and a storage system capable of feeding every worker. A fast GPU attached to a congested filesystem can show low utilization. Benchmark the complete path from the production dataset to device memory, including concurrent checkpoint writes.
Staffing and maintenance
Someone must install drivers, patch firmware, replace failed components, monitor thermals, manage schedulers and secure the data. Include planned downtime and the time required to diagnose failures. Cloud services shift much of this work to the provider but do not eliminate software and training-pipeline operations.
How published cost figures should be interpreted
Lenovo Press’s On-Premise vs Cloud: Generative AI Total Cost of Ownership (2025 Edition) is a vendor-produced illustrative model, not a universal price list or independent head-to-head test. In one scenario it compares a Lenovo ThinkSystem SR675 V3 configured with eight NVIDIA H100 NVL GPUs with an AWS EC2 p5.48xlarge instance containing eight H100 GPUs.
Rank #3
- Video/Sound Cards
- Passive Cooling
| Input or result | Figure in Lenovo’s 2025 scenario | Qualification |
|---|---|---|
| Estimated on-premises system cost | About $833,806 | Report assumption for the specified eight-GPU configuration; not an independently verified market quote. |
| Estimated on-premises power and cooling | About $0.87 per hour | Calculated with an assumed electricity price of $0.15 per kWh; facility conditions vary. |
| Modeled AWS on-demand rate | $98.32 per hour | Rate recorded “at the time of writing” in the report, not a current quote. |
| Modeled breakeven | About 8,556 hours, or 11.9 months | Applies only to that configuration and its assumptions. |
The report also models one-year and three-year cloud commitments. Its lower effective hourly charges move the modeled breakeven later. Do not transfer the 8,556-hour result to another GPU, region, discount, facility or utilization pattern. Hardware prices, cloud rates, exchange rates and electricity costs change; obtain current quotes and substitute your own utilization, staffing, maintenance and storage values.
Free tools Windows power users keep installed
One-click scans. No signup required.
What a case study can—and cannot—prove
An AWS-published deepset NLP case study reports 3.9× faster training and 12.8× lower cost after optimizations including distributed data-parallel training and automatic mixed precision. Those figures describe that specific workload, implementation and baseline. They do not demonstrate that cloud GPUs are generally faster or cheaper than on-premises GPUs. When reading any benchmark, ask whether the baseline used the same software, precision, batch size, network topology, data path and failure assumptions.
Independent reader supportYour contribution helps us test, update, and keep practical guides available for everyone.Build a full lifecycle cost model
Calculate the cost of a completed training run, not merely the price of one GPU-hour.
Cloud run cost = accelerator charges + host and attached-service charges + storage during the run + data transfer or staging + orchestration and monitoring + expected restart and queue-time cost.
On-premises run cost = allocated hardware depreciation or financing + power and cooling + networking and storage allocation + software support + staffing and maintenance + facility overhead + downtime and refresh reserve.
Then divide by useful output, such as converged training tokens or completed fine-tunes. For a fair comparison, use the same target quality and include the hours when GPUs are reserved but waiting for data, evaluation or checkpoint completion. Separate one-time capital expenditure from recurring operating expenditure, and show sensitivity to utilization. A cluster used 90% of the year can amortize hardware very differently from one used 20% of the year.
Capacity and scheduling decision framework
- Estimate the largest simultaneous job. List the minimum and maximum GPU count, memory per GPU and network topology required for the next 12–24 months.
- Measure utilization by time period. Plot active training hours, queue hours, idle hours and maintenance windows. Average utilization can hide peaks that require burst capacity.
- Set the deadline and interruption tolerance. A fixed launch date favors assured capacity; a flexible batch job can exploit interruptible instances if checkpoints are robust.
- Classify the data. Identify residency, access-control, retention and transfer requirements for your jurisdiction and contracts. The appropriate rule is deployment-specific; do not assume that cloud or local infrastructure automatically satisfies it.
- Price at current assumptions. Use current provider rates and hardware quotes, then model electricity, cooling, people, maintenance, storage, transfer and financing.
- Run the workload benchmark. Reject theoretical peak comparisons that omit your data loader, communication pattern and checkpoint behavior.
- Choose one platform or a split. Keep steady, predictable utilization on owned hardware when the economics and operations work; burst, experiment or handle rare large jobs in the cloud when elasticity has greater value.
Common failure modes and fixes
Comparing GPU specifications instead of completed work
Symptom: A newer or more expensive GPU looks faster on paper, but end-to-end training is not. Fix: Measure tokens or samples per second with the real model, precision, memory footprint and interconnect.
Rank #4

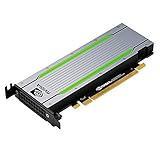
- CUDA Cores: 4608 / NVIDIA Tensor Cores: 576 / NVIDIA RT Cores: 72
- GPU Memory: 24 GB GDDR6 with ECC / Bandwidth: 624 GB/Sec
- System Interface: PCI Express 3.0 x16
- Four DisplayPort 1.4 Connectors
- 3D Stereo Support with Stereo Connector
Using theoretical peak as a cost denominator
Symptom: Cost per teraflop appears low while the job spends time waiting for data or synchronization. Fix: Use measured cost per completed token or sample and report MFU alongside storage and network metrics.
Ignoring startup, queue and checkpoint time
Symptom: A short benchmark looks inexpensive, but production runs miss their deadline. Fix: Include allocation delay, environment setup, data staging, evaluation and checkpoint writes in wall-clock completion time.
Assuming spot capacity is reliable
Symptom: A preempted job loses more work than the hourly saving. Fix: Automate frequent, verified checkpoints; test recovery; and compare expected interruption waste with on-demand or reserved capacity.
Underestimating on-premises operations
Symptom: The purchase price looks favorable, but deployment is delayed by power, cooling, firmware or staffing limits. Fix: obtain facility and support quotes before ordering and assign costs for maintenance, downtime and refresh.
Scaling beyond the network’s capability
Symptom: Adding GPUs produces little additional throughput. Fix: profile collective operations, verify GPU-to-GPU topology and test the intended node count rather than extrapolating from one server.
When a hybrid design is practical
A hybrid arrangement can separate stable and variable demand. Keep sensitive datasets or continuously used fine-tuning workloads on an owned cluster while using cloud capacity for experiments, seasonal demand or a pretraining campaign that exceeds local capacity. Standardize containers, checkpoint formats, identity controls and data-transfer procedures so a job can move without changing its numerical behavior. Price the transfer and synchronization path explicitly; moving many terabytes can erase the apparent benefit of a burst strategy.
Crashes, No Sound, or Screen Glitches?
Random freezes, missing sound and display glitches usually trace back to one bad driver. Find and replace yours safely.Free scan · under a minutePC Slower Than It Used to Be?
A free scan shows the junk files, broken settings and background clutter dragging Windows down - then fixes them in one click.Free scan · Windows 10 & 11Quick Recap
Bottom-line selection rules
- Favor cloud GPUs when utilization is spiky, capacity is needed immediately, the required cluster is larger than your facility, or the team cannot justify operating specialized infrastructure.
- Favor on-premises GPUs when utilization is high and predictable, data remains local, capacity must be available on demand, and power, cooling, networking and support are already funded.
- Favor a hybrid approach when baseline demand is steady but occasional jobs exceed local capacity or require a different accelerator topology.
- In every case, decide from measured time to completion and cost per useful output, with current prices and explicit assumptions—not from a GPU name, a theoretical peak figure or a vendor’s single scenario.
Product prices and availability are accurate as of the date/time indicated and are subject to change. Any price and availability information displayed on Amazon at the time of purchase will apply.

