Free tools Windows power users keep installed
One-click scans. No signup required.
To find delays in a CI/CD pipeline, trace a representative change from version control to release and record, at every step, both elapsed time and time spent doing the work. The gap between those figures can reveal waiting or handoffs to investigate; it does not, by itself, prove the cause. Track rework and production outcomes too, so a faster pipeline does not come at the cost of reliability or security.
What counts as a CI/CD delay?
A change’s total delivery time includes active work and time spent waiting. Build and test duration is only part of that journey: a change may also wait for review, security checks, an available environment, an approval, or a release window. Mapping only the automated jobs can therefore miss substantial delays.
As an Amazon Associate I earn from qualifying purchases.
DORA recommends using value-stream mapping to record total elapsed time and value-add time for each process from version control through release. A large gap between elapsed and active work is a useful signal to investigate possible queues, handoffs, or other waits—not proof that any one of them is the root cause. DORA describes value-stream mapping as a way to discover and anticipate bottlenecks: DORA’s continuous-delivery guidance.
How to map one change through the pipeline
- Choose a representative change. Select a recent change that reflects the workflow you want to understand. Agree on a start point, such as when it enters version control, and an end point, such as when it is released.
- Draw the path it actually takes. Include automated jobs and manual steps: code review, testing, security review, change management, environment provisioning, deployment, and any release step. Follow the change across team boundaries rather than stopping at the CI system.
- Record elapsed and value-add time at every process. Elapsed time is the full time from entering a step to leaving it. Value-add time is time spent doing the work. Keep the definitions consistent across stages, and note retries or returns for correction.
- Measure rework. Track the percentage of work sent back because it was not done right the first time. DORA calls this percentage complete and accurate (%C/A); a low figure can signal a process worth examining alongside long elapsed times.
- Review the map with the teams involved. Ask the people who own the steps to validate the sequence and explain the waits. Agree on a desired future-state process and the capacity to make improvements before changing the workflow.
One change can expose a candidate delay, but it cannot establish whether that delay is typical. Repeat the mapping across enough representative changes to distinguish a recurring pattern from a one-off event. Compare changes with consistent boundaries and record meaningful differences in their paths.
#1 Best Overall

- GIGABIT ETHERNET PORTS: Features 5 x 1.0Gbps Ethernet ports for high-speed connectivity. Auto-negotiating ports detect the optimal speed for connected devices and work with existing Cat5e or Cat6 Ethernet cables.
- PLUG-AND-PLAY UNMANAGED NETWORK SWITCH: Simple plug-and-play setup with no software to install or configuration required.
- FLEXIBLE MOUNTING OPTIONS: Compact metal design supports desktop or wall-mount placement for versatile installation.
- SILENT & ENERGY-EFFICIENT OPERATION: Fanless design ensures silent performance, while IEEE 802.3az Energy Efficient Ethernet reduces power consumption without compromising high-speed network performance.
- REGIONAL COMPATIBILITY: Made for use in U.S. & CA only
Where to look for delays
Source control and code review
Inspect whether changes arrive in large batches, whether branches or review queues accumulate, and how long changes wait before review starts. Measure actual waiting before changing the branching or review process. DORA recommends trunk-based development with short-lived branches as a continuous-delivery practice, but the map should show whether that practice addresses a delay in your workflow.
Build and test
Separate time waiting for a runner or other resources from build work, test execution, retries, and time spent resolving failures. DORA emphasizes quick feedback, reliable automated tests, continuous testing, and adequate test data. A systematic review of 69 papers published through June 1, 2016 grouped approaches to continuous integration, delivery, and deployment around reducing build and test time, improving result visibility, supporting automated testing, detecting faults and violations, security and scalability, and dependable deployment. Its publication window makes it useful as a taxonomy of concerns, not evidence of current tool adoption: the review’s abstract and methodology.
Rank #2

- 𝗢𝗻𝗲 𝗦𝘄𝗶𝘁𝗰𝗵 𝗠𝗮𝗱𝗲 𝘁𝗼 𝗘𝘅𝗽𝗮𝗻𝗱 𝗡𝗲𝘁𝘄𝗼𝗿𝗸: 5× 10/100/1000Mbps RJ45 Ports supporting Auto Negotiation and Auto MDI/MDIX.
- 𝗚𝗶𝗴𝗮𝗯𝗶𝘁 𝘁𝗵𝗮𝘁 𝗦𝗮𝘃𝗲𝘀 𝗘𝗻𝗲𝗿𝗴𝘆: Latest innovative energy-efficient technology greatly expands your network capacity with much less power consumption and helps save money.
- 𝗥𝗲𝗹𝗶𝗮𝗯𝗹𝗲 𝗮𝗻𝗱 𝗤𝘂𝗶𝗲𝘁: IEEE 802.3X flow control provides reliable data transfer and Fanless design ensures quiet operation.
- 𝗣𝗹𝘂𝗴 𝗮𝗻𝗱 𝗣𝗹𝗮𝘆: Easy setup with no software installation or configuration needed.
- 𝗔𝗱𝘃𝗮𝗻𝗰𝗲𝗱 𝗦𝗼𝗳𝘁𝘄𝗮𝗿𝗲 𝗙𝗲𝗮𝘁𝘂𝗿𝗲𝘀: Prioritize your traffic and guarantee high quality of video or voice data transmission with Port-based 802.1p/DSCP QoS and IGMP Snooping.
Security checks and approvals
Put security review, required approvals, and change-management steps on the map rather than treating them as invisible overhead. The goal is not to remove controls blindly, but to identify whether their timing, sequencing, or handoffs can improve without weakening necessary protections. DORA recommends pervasive security and highlights the particular importance of testing and security in regulated and safety-critical domains.
What’s actually slowing this PC down?
Pick the symptom - the matching free tool is one click away.
Environments and deployment
Measure waits for test and production environments separately from deployment work. Check for environment availability, manual release steps, service dependencies, and database changes. DORA recommends deployment automation, managed database changes, monitoring and observability, and loosely coupled teams as practices that support continuous delivery.
Rank #3
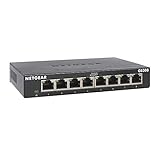
- GIGABIT ETHERNET PORTS: Features 8 x 1.0Gbps Ethernet ports for high-speed connectivity. Auto-negotiating ports detect the optimal speed for connected devices and work with existing Cat5e or Cat6 Ethernet cables.
- PLUG-AND-PLAY UNMANAGED NETWORK SWITCH: Simple plug-and-play setup with no software to install or configuration required.
- FLEXIBLE MOUNTING OPTIONS: Compact metal design supports desktop or wall-mount placement for versatile installation.
- SILENT & ENERGY-EFFICIENT OPERATION: Fanless design ensures silent performance, while IEEE 802.3az Energy Efficient Ethernet reduces power consumption without compromising high-speed network performance.
- REGIONAL COMPATIBILITY: Made for use in U.S. & CA only
Cross-team handoffs
Include the people and teams that own each process. A handoff can create a wait, but a long elapsed time alone does not show which team, approval, or dependency caused it. Use the stage timings and conversations with process owners to identify the specific step that needs closer examination.
Pair pipeline timings with delivery and stability measures
Stage-level data explains where elapsed time accumulates. Outcome measures help determine whether a change to the pipeline actually improves delivery without making production less stable. Track a consistent local definition of:
Rank #4
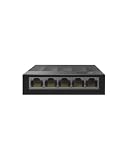
- 【One Switch Made to Expand Network】Features 5 RJ45 ports with 10/100/1000Mbps speeds, supporting Auto-Negotiation and Auto MDI/MDIX for hassle-free setup. Ideal for expanding your network, with 1 uplink (input) port and 4 output ports to split your Ethernet connection to multiple devices.
- 【Gigabit that Saves Energy】Latest innovative energy-efficient technology greatly expands your network capacity with much less power consumption and helps save money
- 【Reliable and Quiet】IEEE 802.3X flow control provides reliable data transfer and Fanless design ensures quiet operation
- 【Plug and Play】Easy setup with no software installation or configuration needed
- 【Ethernet Splitter】Connect to your router or modem for additional wired connections (laptop, gaming console, printer, etc)
- Lead time for changes: the time from the agreed starting point to release.
- Deployment frequency: how often the team deploys.
- Change failure rate: how often a deployment results in a failure under your chosen definition.
- Time to restore service: how long recovery takes after a service-impacting failure.
- Reliability or service objectives: measures that show whether the service continues to meet its expected outcomes.
Metric labels and boundaries are not uniform across reports or software. DORA’s 2021 report page describes five measures for its performance clusters: deployment frequency, lead time for changes, time to restore service, change failure rate, and reliability. DORA’s Core Model and some contemporary product documentation give reliability or service-level objectives a separate role alongside four delivery metrics. State which definitions and time boundaries your team uses rather than treating one list as timeless: DORA’s 2021 report summary.
PC Slower Than It Used to Be?
A free scan shows the junk files, broken settings and background clutter dragging Windows down - then fixes them in one click.Free scan · Windows 10 & 11Outdated Drivers Are Slowing You Down
One free scan finds every outdated or missing driver and matches the right update for your exact hardware.Free scan · exact hardware matchImplementation details can also affect what a metric means. For example, GitLab documents calculations for deployment frequency and lead time using GitLab CI/CD and merge-request data, and describes incident-data requirements for failure and restoration metrics. Those are product-specific implementation details, not universal definitions: GitLab’s DORA metrics documentation.
Best Value

- 𝗘𝗶𝗴𝗵𝘁 𝟮.𝟱 𝗚𝗯𝗽𝘀 𝗣𝗼𝗿𝘁𝘀 𝗳𝗼𝗿 𝗦𝘂𝗽𝗲𝗿-𝗙𝗮𝘀𝘁 𝗖𝗼𝗻𝗻𝗲𝗰𝘁𝗶𝗼𝗻𝘀: 8× 2.5-Gigabit ports unlock the highest performance of your Multi-Gig bandwidth and devices, and provide up to 40 Gbps of switching capacity.
- 𝗔𝘂𝘁𝗼-𝗡𝗲𝗴𝗼𝘁𝗶𝗮𝘁𝗶𝗼𝗻: Auto-negotiation intelligently senses the link speeds and adjusts between 3-speeds (100Mb/1G/2.5G) for compatibility and optimal performance for all your devices, including 2.5G WiFi 6 AP, 2.5G NAS, 2.5G PCIe Adapter, 2.5G Server, gaming computer, 4K video, and more.
- 𝗜𝗱𝗲𝗮𝗹 𝗳𝗼𝗿 𝗩𝗮𝗿𝗶𝗼𝘂𝘀 𝗦𝗰𝗲𝗻𝗮𝗿𝗶𝗼𝘀: Built for LAN parties, home entertainment, small and home offices, and instant transfer for workstations.
- 𝗛𝗮𝘀𝘀𝗹𝗲-𝗙𝗿𝗲𝗲 𝗖𝗮𝗯𝗹𝗶𝗻𝗴: Instantly upgrade to 2.5 Gbps without the need to upgrade to Cat6 wiring, reducing wiring costs and hassle. *
- 𝗦𝗶𝗹𝗲𝗻𝘁 𝗢𝗽𝗲𝗿𝗮𝘁𝗶𝗼𝗻: Industry-leading fanless design ensures silent operation, ideal for any home or business.
Decide whether a change is justified
Use the map to form a specific hypothesis—for example, that a recurring resource queue or approval handoff is adding elapsed time. Then choose an intervention aimed at that measured issue, and compare the same stage and delivery outcomes before and after. A change is more persuasive when it reduces the relevant delay or rework while maintaining change failure, recovery, reliability, and security outcomes.
When assessing a process, architecture, test, environment, or tool change, consider:
- Which observed wait or rework does it address?
- Does it reduce elapsed time, active work, or both?
- What happens to change failures, restoration time, reliability, and security?
- Does it work with the existing toolchain, or add another integration or handoff?
- What changes to team responsibilities or processes are required?
Tool adoption alone is not a diagnosis or a guaranteed fix. DORA notes that pipeline implementation often accompanies process and architecture changes. The CD Foundation’s 2024 report summary describes an association between CI/CD tool use and better performance, while also reporting worse performance when developers used multiple tools of the same form and suggesting interoperability as a likely explanation. These findings do not rank vendors or prove that a particular tool caused the difference. The report says 83 percent of developers report involvement in DevOps-related activities; its methodology combines six Developer Nation surveys from Q3 2020 to Q1 2023, which together reached more than 125,000 respondents worldwide. The latest survey data included was collected from December 2022 through February 2023, so the combined reach should not be mistaken for the report’s analytic sample size: the CD Foundation / SlashData report summary and methodology.
Quick wins for a faster PC:
Scan for outdated or missing drivers - takes under a minuteDriver Scan →Repair Windows errors before they cause bigger problemsFix Now →Keep speed in context
Shorter lead times matter only when the team can still release safely and serve users reliably. DORA’s 2024 report summary discusses potential tradeoffs involving stability or throughput in relation to AI and internal developer platforms, and highlights user-centricity and stable priorities. Google Research’s record says the report heard from more than 39,000 professionals; that is report participation, not a measurement of CI/CD pipeline duration. See DORA’s 2024 findings summary and Google Research’s report record.
Continuous integration is only one part of continuous delivery. Reliable tests, deployment automation, version control, continuous testing, observability, available test data, security, and team design all contribute to a team’s ability to release safely. Treat a faster stage as an intermediate result; the broader test is whether the complete delivery path improves without undermining service outcomes.
Quick Recap
Product prices and availability are accurate as of the date/time indicated and are subject to change. Any price and availability information displayed on Amazon at the time of purchase will apply.

