PC Slower Than It Used to Be?
A free scan shows the junk files, broken settings and background clutter dragging Windows down - then fixes them in one click.Free scan · Windows 10 & 11Crashes, No Sound, or Screen Glitches?
Random freezes, missing sound and display glitches usually trace back to one bad driver. Find and replace yours safely.Free scan · under a minuteTo automatically create a cryptocurrency price graphic, choose the output first: embed a live, interactive chart on a website, or generate a branded chart image for a post or report. For a quick website display, use a current CoinGecko or TradingView widget. For a graphic you control, retrieve market-chart data from an API and render it with your own charting code. If the finished result is a web page or widget that you need to save as an image, capture that page after it renders.
The right route depends on how much design control you need, whether the graphic must be static or interactive, and the provider’s current access and reuse terms. Below is a practical way to choose, build, and check each kind of output.
Choose the graphic you need
A price graphic can mean several different things. A website widget is an interactive component displayed in a page. A custom-rendered graphic is an image you generate from a price series. A screenshot is a raster image of a rendered web page or widget. They can all show prices, but they are not interchangeable: an embed is convenient for visitors to explore, while a static image is easier to place in a report or social post.
| Route | Best for | What you build | Main tradeoff |
|---|---|---|---|
| CoinGecko widget | A quick website price or chart display | Configure and embed a widget | Fast to add, but check the current widget lifecycle and options. |
| TradingView widget | An interactive chart or multi-part market overview | Embed an HTML snippet or React component | Uses built-in market data for standard widgets; presentation is bounded by available widget options. |
| CoinGecko API plus your renderer | A branded, static or highly customized chart | Retrieve historical market-chart data, then render it yourself | More design control, with added data handling and implementation work. |
| TradingView charting integration | A configurable chart connected to a custom data source | Implement a JavaScript object that meets its data-feed interface | Greater integration effort and responsibility for a compatible feed. |
These routes are not a pricing or licensing comparison. The cited product documentation establishes capabilities, but not a complete account of current API limits, redistribution rights, data delay, or all terms. Verify those points with the provider before using the output in a production or commercial workflow.
The Tool Desk
Outbyte Driver Updater FREEFix the driver behind crashes, sound loss and screen glitchesFind Drivers →Outbyte PC Repair FREERepair Windows errors before they cause bigger problemsFix Now →#1 Best Overall

- CryptoTicr is a passion project of a dedicated USA-based creator focused on crafting the finest cryptocurrency ticker available. This gadget provides a remarkable experience and includes a Two-Year Warranty and USA-based support directly from it's creator.
- Live Real-Time Prices: CryptoTicr displays up-to-the-minute cryptocurrency prices for any of the top 1,000 coins (by market share), always on, always keeping you informed, 24x7x365.
- Attractive Design: Enjoy a sleek, retro-minimalist look paired with a bright and brilliant, razor-crisp 1.54" display, featuring a 240x240 pixel resolution IPS display panel with adjustable brightness.
- No Subscriptions, Fees, or Accounts: Everything you need is built in along with free perpetual access to its data feed.
- No Apps: It's built-in web server technology makes it easy to control from any smartphone, tablet or computer connected to your existing Wi-Fi network with just a web browser.
Use a widget for the fastest website chart
CoinGecko: a configurable price display
CoinGecko offers website widgets for cryptocurrency information, including coin price charts. For a standard website display, inspect its current widget catalog, choose the appropriate widget, and configure the asset and presentation options it offers. The widget route avoids building a market-data retrieval and chart-rendering pipeline yourself.
Pay attention to the lifecycle notice on CoinGecko’s widget page: older widgets are expected to continue working while support is gradually phased out, and the page recommends moving to the latest widgets. For a new implementation, start with the latest option rather than copying an older embed from an existing page. If you already have an older widget, check its status and plan a migration instead of assuming it will remain supported indefinitely.
TradingView: an interactive chart or dashboard
TradingView’s financial widgets can be embedded using HTML snippets or React components, and its getting-started documentation describes them as including built-in market data. That makes a widget a sensible choice when the aim is an interactive chart without implementing a data feed from scratch.
If one chart is not enough, TradingView’s crypto dashboard example combines a chart, symbol information, a heatmap, and market widgets. That is useful when the deliverable is a market overview rather than a single coin-price graphic. Review the current widget catalog and options to decide whether the supplied presentation fits your page; a standard embed is quicker, but it does not give you the same freedom as rendering every element yourself.
Do these 3 things before closing this tab:
1Fix the driver behind crashes, sound loss and screen glitches2Repair Windows errors before they cause bigger problems3Scan for outdated or missing drivers - takes under a minuteRank #2

- Supports 300 Mainstream Cryptocurrencies — Easily switch between 300 popular coins including Bitcoin, Ethereum and others for flexible real-time monitoring on this compact crypto price display.
- WiFi Connectivity for Fast Updates — Connects to 2.4GHz WiFi networks to refresh cryptocurrency prices quickly and display live data without missing market changes.
- No App or Account Required — Operates independently without any mobile app, login, or personal account to maintain privacy during use as a desktop crypto ticker.
- Real-Time Information Display — Shows coin name, current time, 24-hour percentage change, live price in USD, and 7-day trend line graph on the 1.37-inch screen for clear cryptocurrency tracking.
- Simple Plug-and-Play Setup — Powered via included USB data cable (no built-in battery), features a clean interface for easy operation; English language only, compact size ideal for desk or nightstand placement.
Widget setup checklist
- Decide whether the page needs one asset chart or a broader market overview.
- Open the provider’s current widget catalog and select a current widget rather than relying on a legacy snippet.
- Set the asset, quote currency, time range, and visual theme where those settings are available.
- Place the resulting embed in the page using the documented HTML or React approach.
- Load the published page and verify that the intended asset, currency, range, and layout are visible.
CoinGecko’s widget page is titled Free Cryptocurrency Price Widgets; its API page is titled Crypto API for Analytics & Tools. TradingView’s relevant documentation includes Your Starting Point For Financial Widgets, Multiple Widget Solutions for Your Website, and Widget Constructor. Consult the current provider documentation for implementation details rather than assuming a particular option, embed snippet, or access condition applies to every widget.
Build a custom graphic from market data
If the finished asset must match your own brand or layout, use an API for the price series and a separate renderer for the visual. CoinGecko describes historical market-chart data as an API use case and says its API includes more than ten years of historical coin data. This is source capability, not a guarantee that every asset, interval, or account has identical availability; check current API access details and terms for the data you need.
Plan the data-to-image pipeline
- Specify the chart. Choose the coin, quote currency, timeframe, and intended output dimensions. Decide whether the chart should show a line, labels, grid, or other context.
- Confirm data availability. Check that the source covers the asset and historical interval you need, and review current API access, limits, and permitted reuse.
- Retrieve the market series. Request the historical market-chart data using the provider’s current API documentation. Keep the returned timestamps and price values together; do not silently treat a missing value as zero.
- Render the chart. Pass the series to your chosen charting or graphics library. For a static asset, render to an image format supported by your publishing workflow; for a web chart, render in the page and capture it only if a static copy is also required.
- Label the result. Include the asset, quote currency, timeframe, and data timestamp. Readers need those details to interpret a price image rather than mistake a historical snapshot for a live quote.
- Validate before publishing. Compare a few plotted values with the retrieved series, check that the time axis is ordered correctly, and inspect the final image at the size where it will appear.
This is the most flexible route, but it is also the one with the most responsibilities. You must handle data retrieval, errors, timestamps, rendering, and any terms that apply to API access and redistribution. The reviewed provider documentation does not establish a universal rate limit, price delay, attribution rule, or redistribution permission; check the applicable current terms instead of assuming a policy.
Use a TradingView data feed when you need deeper chart integration
TradingView’s Advanced Charts documentation describes connecting a custom data source through a JavaScript object that implements its data-feed interface. This route is for developers who need configurable charting tied to an external or custom feed, not for someone who simply wants to display a standard widget.
Free tools Windows power users keep installed
One-click scans. No signup required.
Rank #3

- Multi-Market Coverage Supports cryptocurrencies, spot gold, spot silver, forex, US stocks, Hong Kong stocks, and A-shares. Cryptocurrency data is sourced from Binance, OKX, Bybit, and Gate.
- Large LED Display with Adjustable Brightness Features high-definition LED beads for sharp, clear fonts. Brightness can be manually adjusted—bright enough for daytime use and gentle on the eyes at night.
- Price Alerts with Audible Notifications Set target prices for your preferred assets. When the market price reaches the set level, the device automatically sounds an alert.
- WiFi Connectivity with Easy Setup After connecting to WiFi, configure the device via a mobile or computer web interface. Price icons are customizable, making different asset types easy to identify at a glance.
- Compact Size for Flexible Placement Measures approximately 6.3 × 1.9 × 1.9 inches, taking up minimal desk space. Supports either fixed display of a single price or rotating carousel of multiple assets.
Before committing, read the documented data-feed requirements and map them against the data you can supply. The implementation must meet the expected interface; having a price API alone does not make it a compatible feed. Budget time for integration and verification, and confirm current access and licensing conditions for the charting product and data source. The documented capability does not, by itself, establish pricing, redistribution rights, or a particular data latency.
Turn a rendered chart into a screenshot
If you have an interactive chart or dashboard on a web page but need a static image, capture the rendered page after its content has loaded. A screenshot records what the browser displays; it does not replace the underlying data source or guarantee that values are current. Configure the page for the intended viewport and make sure the relevant chart area is visible before capture.
- Build or configure the widget or chart page and choose the final asset, currency, timeframe, and theme.
- Open the page in a browser and wait until the chart has visibly rendered. If it depends on asynchronous data, do not capture immediately on navigation.
- Set the viewport or page area to match the intended graphic. Check that labels and axes are not clipped.
- Capture the page or chart, then inspect the image for loading placeholders, overlays, missing fonts, or truncated content.
- Keep the asset, currency, timeframe, and data timestamp available in the graphic or its caption.
Or skip the browser setup
For a page you can access at a URL, ScreenshotNeo can return a screenshot directly from one GET request. Its API can return PNG, JPEG, WebP, or PDF, and its capture options include full-page capture and selecting an element by CSS selector. See the ScreenshotNeo API documentation for request details.
curl -G "https://api.screenshotneo.com/v1/shot" -d access_key=YOUR_API_KEY --data-urlencode url=https://stripe.com -o shot.webpReplace the example URL with the page containing your chart. ScreenshotNeo accepts cookie or consent banners as a visitor and removes more than 60 known consent platforms, newsletter popups, and chat widgets before capture; each of those steps can be turned off. Bot checks and CAPTCHAs, blank pages, timeouts, failed loads, and cache hits are not billed, and response headers report the page verdict and whether the request was billed. Its MCP server provides take_screenshot, get_page_info, and capture_pdf tools for Claude, Cursor, and other MCP clients. Plans include 1,000 shots per month free without a card; paid plans start at $5 for 3,000 shots. See ScreenshotNeo for plan details and product information. Sign up free for 1,000 screenshots a month, with no card required.
Prevent misleading or fragile price graphics
- Show what is being measured. Label the asset and quote currency; the same numeric price means different things in different currencies.
- Show the period and timestamp. A chart without a timeframe or data timestamp can be mistaken for a live market quote.
- Choose an appropriate route for the output. Use an embed when interactivity matters, a custom renderer when visual control matters, and a screenshot when you need a static copy of an already rendered page.
- Check the current source terms. API access, rate limits, attribution, licensing, latency, and redistribution conditions are not fully established by the widget and capability pages described here.
- Revisit legacy embeds. CoinGecko says older widgets will continue to work while support is gradually phased out, and recommends its latest widgets.
Troubleshooting
The widget is missing or looks different from the example
Confirm that you used a current widget configuration rather than an older embed. CoinGecko’s widget page notes the gradual phase-out of older widgets. For either provider, revisit the current catalog and documentation and verify that the asset and display settings are supported by the selected widget.
Rank #4
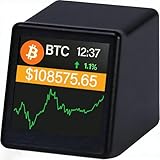
- WATCH BITCOIN MOVE IN REAL TIME: See live Bitcoin price updates right on your desk. No apps, no refreshing—just glance and know where the market stands
- COMPACT BUT CLEAR DESK DISPLAY: The 1.54" screen is designed for quick, distraction-free viewing—perfect beside your monitor or laptop
- PERFECT FOR OFFICE, HOME & CRYPTO FANS: A clean, minimalist look that fits modern desks and makes a great conversation starter for Bitcoin enthusiasts
- TRACK BITCOIN & TOP CRYPTO PRICES: Supports Bitcoin , Ethereum, Dogecoin and major cryptocurrencies using reliable real-time market data via Wi-Fi
- A UNIQUE GIFT FOR BITCOIN LOVERS: Ideal for birthdays, holidays, or anyone who lives and breathes crypto
The screenshot shows a blank chart or loading state
The chart may not have finished rendering when the image was captured, or the page may not have loaded successfully. In a browser workflow, wait until the chart is visibly present before capturing. If you use an API capture, inspect its page verdict and billed-status response headers where available, and check the page itself before treating an empty image as a valid chart.
The custom chart has gaps or incorrect time labels
Check the returned timestamps and values before rendering. Preserve their pairing, sort or interpret them according to the API response’s documented format, and do not convert missing data into zero. Verify the time zone and label the graphic’s data timestamp so readers can distinguish the data period from the time it was generated.
The chart looks right but cannot be reused as intended
A chart rendering correctly does not establish permission to republish its data or embed. Check the current provider terms for your use case, including attribution, redistribution, and commercial use, before shipping the graphic.
Which route should you choose?
- Choose a current CoinGecko widget for a quick coin-price display on a website.
- Choose a TradingView widget for a standard interactive chart or a market overview assembled from its widgets.
- Choose CoinGecko API data and your own renderer when you need a branded static graphic or custom visual design.
- Choose TradingView’s custom data-feed integration when your chart needs deeper customization and you are prepared to implement its JavaScript interface.
- Capture the rendered page when you need a static copy of a widget or chart that otherwise lives on the web.
Frequently Asked Questions
Can I automatically generate a graphic for a coin that has limited history?
Availability depends on the selected data source and asset. Check the current API coverage and the specific interval you need before building the graphic.
Does a screenshot make a cryptocurrency chart live?
No. A screenshot is a static capture of a rendered page. Its values reflect what that page displayed at capture time, not subsequent market changes.
Quick Recap
Product prices and availability are accurate as of the date/time indicated and are subject to change. Any price and availability information displayed on Amazon at the time of purchase will apply.




