Freedom251 › Kubernetes Monitoring
Perses
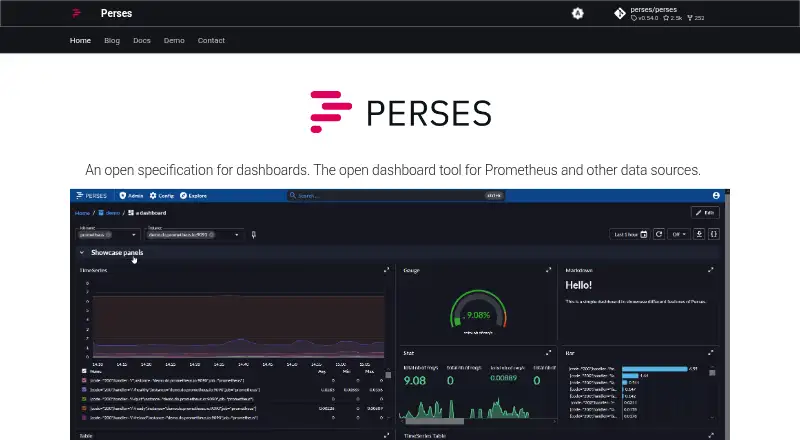
What Perses is
Perses is an open dashboard tool for displaying observability data from Prometheus, Tempo, Loki and Pyroscope. Its Prometheus features include specialized visualization panels, a metrics explorer and a PromQL debugger. Teams can use SDKs to define dashboards as code and reuse components, while developers can embed panels or dashboards in their own interfaces through Perses npm packages without running the full application. The percli command-line tool can perform actions in CI/CD pipelines, and a Kubernetes operator manages instances and dashboards declaratively using Custom Resources. A plugin-based architecture allows extensions. Perses provides native user management, supports external OIDC or OAuth identity providers and uses a Kubernetes-inspired RBAC system with roles, role bindings and fine-grained permissions. Grafana dashboards can be imported through the web interface or migrated in batches with percli, though translation is described as best effort. Installation documentation covers Docker or Podman containers and Homebrew on macOS or Linux. Perses is a CNCF sandbox project released under the Apache 2.0 License and is free.
Who it suits
Perses may suit teams that need dashboards for observability data and want to manage them through code or Kubernetes. Its embed packages and CI/CD tooling may also fit developers building dashboards into their own workflows or interfaces.
What it does well
- Supports Prometheus, Tempo, Loki and Pyroscope data.
- SDKs support dashboard-as-code and component reuse.
- Panels and dashboards can be embedded using npm packages.
- Includes native user management and external identity providers.
- Grafana dashboards can be imported or batch-migrated.
What to know first
- Grafana dashboard translation is described as best effort.
- Container installation documentation covers Docker or Podman.
- The project is a CNCF sandbox project.
Plans
| Plan | Billed and limits | Price |
|---|---|---|
| Perses | 100% open source · Apache 2.0 License | Free |
As perses.dev lists them, read 5 Oct 2026. The maker's own page has the final word.
Getting started
- Visit the Perses website and consult its installation documentation.
- Install with Docker or Podman, or use Homebrew on macOS or Linux.
- Connect observability data such as Prometheus, Tempo, Loki, or Pyroscope.
- Build dashboards in the UI or use SDKs to define them as code.
- For Kubernetes management, use the Perses operator and Custom Resources.
Verdict
Perses offers free, open-source dashboards with data integrations, code-oriented workflows and access controls. Grafana migration is available, but translation is not guaranteed to be exact.
Questions
How much does Perses cost?
The Perses plan is free.
Is Perses open source?
Yes. Perses is released under the Apache 2.0 License.
Which observability data does it support?
It supports Prometheus metrics, Tempo traces, Loki logs, and Pyroscope profiles.
Which platforms are listed for Perses?
The listed platforms are API, Linux, macOS, self-hosted, and web.
Can it import Grafana dashboards?
Yes. Dashboards can be imported through the web UI or migrated in batches with percli. Translation is described as best effort.
How can users get support?
For general questions, the project points users to GitHub Discussions or its CNCF Slack channel.
Facts from Perses's own pages
- Authentication
- Perses supports native user management and external OIDC or OAuth identity providers. · perses.dev, 5 Oct 2026
- Authorization
- Its access controls use a Kubernetes-inspired RBAC system with roles, role bindings, and fine-grained permissions. · perses.dev, 5 Oct 2026
- CI/CD
- The native percli command-line tool can perform actions in CI/CD pipelines. · perses.dev, 5 Oct 2026
- Dashboard-as-Code
- Perses provides SDKs for writing dashboards as code and reusing components across dashboards. · perses.dev, 5 Oct 2026
- Embed dashboards
- Developers can embed panels and dashboards in their own UIs using Perses npm packages, without running the full application. · perses.dev, 5 Oct 2026
- Grafana migration
- Grafana dashboards can be imported through the web UI or migrated in batches with percli, with translation described as best effort. · perses.dev, 5 Oct 2026
- Install options
- The documentation describes container installation with Docker or Podman and Homebrew installation on macOS or Linux. · perses.dev, 5 Oct 2026
- Kubernetes
- The Perses operator manages instances and dashboards declaratively using Kubernetes Custom Resources. · perses.dev, 5 Oct 2026
- Plugins
- Perses has a plugin-based architecture that lets users extend its capabilities. · perses.dev, 5 Oct 2026
- Project status
- Perses is a Cloud Native Computing Foundation sandbox project and is released under the Apache 2.0 License. · perses.dev, 5 Oct 2026
- Prometheus tools
- Prometheus support includes specialized visualization panels, a metrics explorer, and a PromQL debugger. · perses.dev, 5 Oct 2026
- Purpose
- Perses is an open dashboard tool for displaying observability data. · perses.dev, 5 Oct 2026
- Security contact
- The project directs security issues to an email list seen only by core team members. · perses.dev, 5 Oct 2026
- Support
- For general questions, the project points users to GitHub Discussions or its CNCF Slack channel. · perses.dev, 5 Oct 2026
- Supported data
- It supports Prometheus metrics, Tempo traces, Loki logs, and Pyroscope profiles. · perses.dev, 5 Oct 2026
Where Perses stands on Freedom251
- Kubernetes Monitoring#16 of 54