Freedom251 › Data Visualization Libraries Software
ApexCharts
by ApexCharts
What ApexCharts is
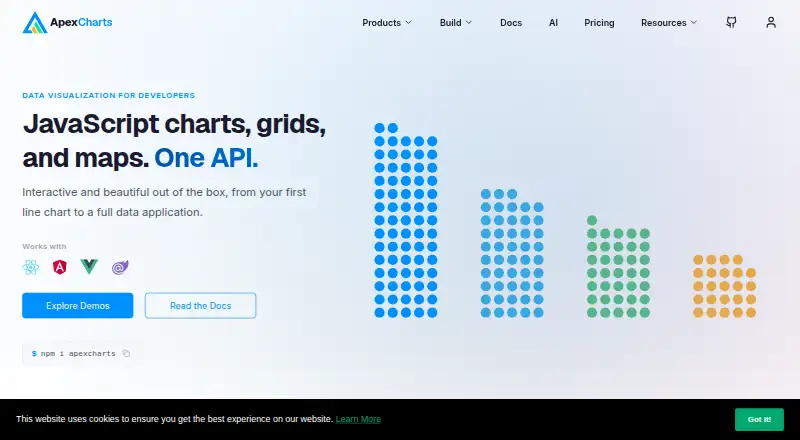
ApexCharts is a JavaScript charting library for interactive visualizations in applications and dashboards. It offers line, area, bar, candlestick, heatmap, treemap, pie, and radar charts, among other types. Data can be supplied as JavaScript arrays and objects. Viewers can zoom, pan, scroll, toggle series visibility, and use hover tooltips. Charts adapt to desktop, tablet, and mobile screens, with configurable layouts for different screen sizes.
The library works directly with vanilla JavaScript and provides official wrappers and integration guides for React, Vue, Angular, and Blazor. Its apexcharts/ssr package can render static SVG on a server and restore browser interactivity through hydration. Charts support gradients, images, patterns, drop shadows, and more than ten built-in color palettes. Keyboard navigation, ARIA attributes, and screen reader support are enabled by default, and dashboards can be embedded.
ApexCharts has a free Community plan for organizations under $2 million USD in annual revenue. Organizations at or above that threshold need a Commercial License. Paid plans start at $199 per developer per year for Community + Commercial, and higher plans add support incidents or Premium features; OEM is priced per app per year. The project says it was released in July 2018 and identifies Juned Chhipa as its founder and active maintainer.
Who it suits
ApexCharts suits developers building interactive charts for web applications and dashboards, including those working with vanilla JavaScript, React, Vue, Angular, or Blazor. Its commercial licensing threshold and plan features are relevant to organizations choosing a license.
What it does well
- Includes line, bar, heatmap, treemap, pie, and other chart types.
- Supports zooming, panning, scrolling, series toggles, and hover tooltips.
- Responsive layouts can be configured for different screen sizes.
- Keyboard navigation, ARIA attributes, and screen reader support are enabled by default.
- Official wrappers and guides cover React, Vue, Angular, and Blazor.
What to know first
- Organizations with $2 million USD or more in annual revenue need a Commercial License.
- Storyboard and other named advanced features require Premium or OEM plans.
- Community support through GitHub issues has no response-time commitment.
Limits
The free Community plan is for organizations under $2 million USD in annual revenue; organizations at or above that threshold need a Commercial License. Storyboard, Linked Views and Crossfilter, annotation authoring, Measure Ruler, Context Menu, Shareable Views, and Undo/Redo are limited to Premium and OEM plans.
Plans
| Plan | Billed and limits | Price |
|---|---|---|
| Community + Commercial | per developer / year · Community features · 1 year of updates · Community support | $199 a year |
| Pro | per developer / year · 1 year of updates · 5 support incidents | $349 a year |
| Premium | per developer / year · 1 year of updates · 10 support incidents · Premium features | $599 a year |
| OEM | per app / year · 1 year of updates · 20 support incidents · OEM license | $14,999 a year |
| Community | Free for orgs under $2m in revenue · Community support | Free |
As apexcharts.com lists them, read 3 Oct 2026. The maker's own page has the final word.
Getting started
- Visit the ApexCharts website.
- Choose a plan based on your organization's annual revenue and required features.
- Use ApexCharts directly with vanilla JavaScript or follow an official framework wrapper or integration guide.
- Supply chart data as JavaScript arrays or objects.
- Configure chart types, interactions, and responsive layouts for your application or dashboard.
Verdict
Choose ApexCharts if you need interactive charts for an application or dashboard and its JavaScript integrations suit your stack. Organizations at or above $2 million USD in annual revenue need a Commercial License, and Premium-only features or support allowances may require a higher paid plan.
Questions
Is ApexCharts free?
Yes. The Community plan is free for organizations under $2 million USD in annual revenue. Organizations at or above that amount must obtain a Commercial License.
How much do the paid plans cost?
Community + Commercial costs $199 per developer per year. Pro is $349 per developer per year, Premium is $599 per developer per year, and OEM is $14,999 per app per year.
Which frameworks does ApexCharts support?
It can be used directly with vanilla JavaScript. Official wrappers and integration guides are provided for React, Vue, Angular, and Blazor.
What data sources does it use?
The listed data sources are JavaScript arrays and objects.
Which features require Premium or OEM?
Storyboard, Linked Views and Crossfilter, annotation authoring, Measure Ruler, Context Menu, Shareable Views, and Undo/Redo are licensed for Premium and OEM plans only.
What support comes with the plans?
Paid subscriptions include a yearly incident allowance: five for Pro, ten for Premium, and twenty for OEM. Community users can seek best-effort help through GitHub issues without a response-time commitment.
Facts from ApexCharts's own pages
- Accessibility
- Built-in keyboard navigation, ARIA attributes, and screen reader support are enabled by default. · apexcharts.com, 3 Oct 2026
- Chart types
- The product includes line, area, bar, candlestick, heatmap, treemap, pie, radar, and other chart types. · apexcharts.com, 3 Oct 2026
- Company history
- ApexCharts says the project was released in July 2018 and identifies Juned Chhipa as its founder and active maintainer. · apexcharts.com, 3 Oct 2026
- Dashboard type
- interactive · apexcharts.com, 22 Sept 2026
- Data sources
- JavaScript arrays and objects · apexcharts.com, 22 Sept 2026
- Embedded dashboards
- Yes · apexcharts.com, 22 Sept 2026
- Founded
- 2018 · apexcharts.com, 19 Oct 2026
- Framework integrations
- Official wrappers and integration guides are provided for React, Vue, Angular, and Blazor, alongside direct vanilla JavaScript use. · apexcharts.com, 3 Oct 2026
- Free plan
- Yes · apexcharts.com, 22 Sept 2026
- Interactions
- Charts support zooming, panning, scrolling, series visibility toggling, and hover tooltips. · apexcharts.com, 3 Oct 2026
- License threshold
- Organizations with $2 million USD or more in annual revenue must obtain a Commercial License to use ApexCharts. · apexcharts.com, 3 Oct 2026
- Platform
- web · apexcharts.com, 22 Sept 2026
- Premium feature limits
- Storyboard, Linked Views and Crossfilter, annotation authoring, Measure Ruler, Context Menu, Shareable Views, and Undo/Redo are licensed for Premium and OEM plans only. · apexcharts.com, 3 Oct 2026
- Product
- ApexCharts is a JavaScript charting library for interactive data visualizations in applications and dashboards. · apexcharts.com, 3 Oct 2026
- Responsive design
- Charts adapt to desktops, tablets, and mobile screens, with configurable layouts for different screen sizes. · apexcharts.com, 3 Oct 2026
- Server rendering
- The apexcharts/ssr package can render static SVG on the server and restore browser interactivity through hydration. · apexcharts.com, 3 Oct 2026
- Styling
- Charts support gradients, images, patterns, drop shadows, and more than ten built-in color palettes. · apexcharts.com, 3 Oct 2026
- Support
- Paid subscriptions include a yearly incident allowance, while Community users can seek best-effort help through GitHub issues without a response-time commitment. · apexcharts.com, 3 Oct 2026
- Use cases
- The maker describes ApexCharts as suitable for commercial and non-commercial projects, including apps and dashboards. · apexcharts.com, 3 Oct 2026
Where ApexCharts stands on Freedom251
- Data Visualization Libraries Software#4 of 23
- Data Visualization Software#31 of 98