Freedom251 › Data Visualization Software
ZoomCharts
by ZoomCharts
What ZoomCharts is
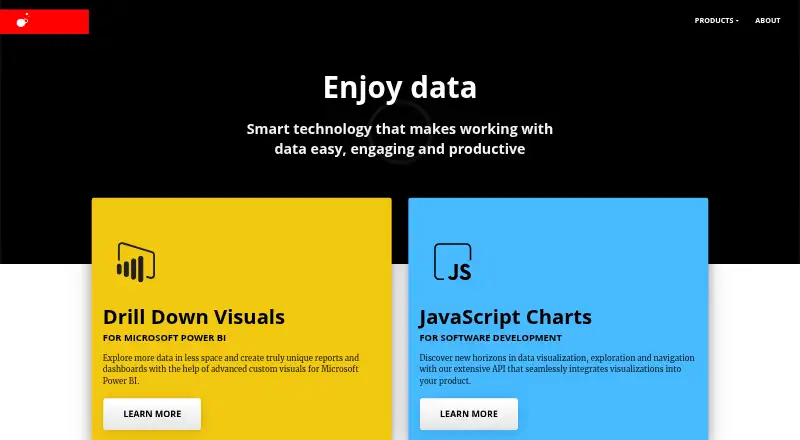
ZoomCharts provides interactive Drill Down visuals for Microsoft Power BI and a JavaScript/HTML chart library for web applications. Its Power BI collection includes Donut, Pie, Combo, TimeSeries, Timeline, Network, Graph, Waterfall, and Map charts. Users can drill down, cross-filter across charts, and interact with mouse or touch input; visuals can also be embedded in dashboards. Listed data sources include MongoDB, MySQL, Microsoft SQL Server, and Neo4j. The visuals are distributed through Microsoft AppSource and work within Microsoft Power BI. AppSource pricing starts at 0.99 EUR/USD per month per user for one custom visual, or 2.99 EUR/USD per month per user for the full Drill Down Visuals bundle. A 30-day free trial is available, with extensions by request. ZoomCharts says its Power BI visuals do not collect or store report data, which is processed by Microsoft Power BI. The company offers technical support, documentation, and video tutorials, and is headquartered in Riga, Latvia.
Who it suits
It suits Power BI users who need interactive charts, drill-down exploration, and embedded dashboards. Developers can use the JavaScript library with server-side languages and client-side frameworks.
What it does well
- Multiple interactive Power BI chart types
- Drill-down and cross-filtering support
- Mouse and touch interaction
- 30-day free trial
- Online and offline use supported
What to know first
- No free plan
- Public unauthenticated publishing requires an External Viewer Site License
- Map PRO is not Microsoft security certified
- Enterprise and several licenses require custom quotes
Plans
| Plan | Billed and limits | Price |
|---|---|---|
| Single custom visual | One Power BI custom visual | On request |
| Full visual bundle | Full bundle of Drill Down Visuals | On request |
| Developer-only licensing | For Power BI report developers | On request |
| Power BI capacity-based licensing | For Power BI capacity deployments | On request |
| External viewer / public site licensing | Unlimited public users within a single domain | On request |
| Enterprise licensing | Enterprise deployments | On request |
| Single custom visual (AppSource) | Per user · price starts at 0.99 EUR/USD per month | 0.99 EUR/USD a month |
| Drill Down Visuals bundle (AppSource) | Per user · includes all Drill Down Visuals · price starts at 2.99 EUR/USD per month | 2.99 EUR/USD a month |
The first 8 of 9 plans, as zoomcharts.com lists them, read 21 Sept 2026. The maker's own page has the final word. Every plan
Verdict
ZoomCharts offers broad interactive visualization choices for Power BI plus a separate JavaScript library. Its trial and AppSource entry pricing help evaluation, while public publishing and licensing requirements vary by deployment.
Facts from ZoomCharts's own pages
- Company scale
- The About page reports that ZoomCharts serves customers in 100+ countries and has 25K+ companies and 100K+ users. · zoomcharts.com, 11 Oct 2026
- Dashboard type
- interactive · zoomcharts.com, 21 Sept 2026
- Data handling
- The maker says the Power BI visuals do not collect or store report data, which is processed by Microsoft Power BI. · zoomcharts.com, 11 Oct 2026
- Data sources
- MongoDB,MySQL,Microsoft SQL Server,Neo4j · zoomcharts.com, 21 Sept 2026
- Embedded dashboards
- Yes · zoomcharts.com, 21 Sept 2026
- Exploration
- The Power BI visuals support drill-down and cross-filtering across charts. · zoomcharts.com, 11 Oct 2026
- Founded
- 2013 · zoomcharts.com, 28 Sept 2026
- Free plan
- No · zoomcharts.com, 21 Sept 2026
- Headquarters
- Riga, Latvia · zoomcharts.com, 28 Sept 2026
- Integrations
- ZoomCharts Power BI visuals are available through Microsoft AppSource and work within Microsoft Power BI. · zoomcharts.com, 11 Oct 2026
- Interaction
- The maker says its Power BI interactions support mouse and touch input. · zoomcharts.com, 11 Oct 2026
- JavaScript library
- The JavaScript/HTML library adds interactive charts to applications and can be used with server-side programming languages and client-side frameworks. · zoomcharts.com, 11 Oct 2026
- Licensing
- Power BI licensing options include per-user, developer-only, capacity-based, external viewer or public site, and enterprise licensing, with custom quotes offered. · zoomcharts.com, 11 Oct 2026
- Offline use
- The maker says the visuals bundle the assets needed to display information and can be used in online and offline environments. · zoomcharts.com, 11 Oct 2026
- Platform
- web_and_desktop · zoomcharts.com, 21 Sept 2026
- Power BI visuals
- The Drill Down visuals include chart types such as Donut, Pie, Combo, TimeSeries, Timeline, Network, Graph, Waterfall, and Map. · zoomcharts.com, 11 Oct 2026
- Products
- ZoomCharts offers interactive Drill Down visuals for Microsoft Power BI and a JavaScript chart library for web applications. · zoomcharts.com, 11 Oct 2026
- Public publishing limit
- Publishing reports with the visuals to a public website without per-user authentication requires an External Viewer Site License, which allows unlimited public users on one domain. · zoomcharts.com, 11 Oct 2026
- Security certification
- The maker states that all Drill Down Visuals except Drill Down Map PRO are Microsoft security certified; Map PRO is excepted because it can connect to an external service. · zoomcharts.com, 11 Oct 2026
- Support
- ZoomCharts offers product assistance, sales contact, technical support, documentation, and video tutorials for the Power BI visuals. · zoomcharts.com, 11 Oct 2026
- Trial
- The Power BI visuals have a 30-day free trial, and an extension can be requested from the company. · zoomcharts.com, 11 Oct 2026
Where ZoomCharts stands on Freedom251
- Data Visualization Software#80 of 98