Freedom251 › Data Visualization Software
Vizumap
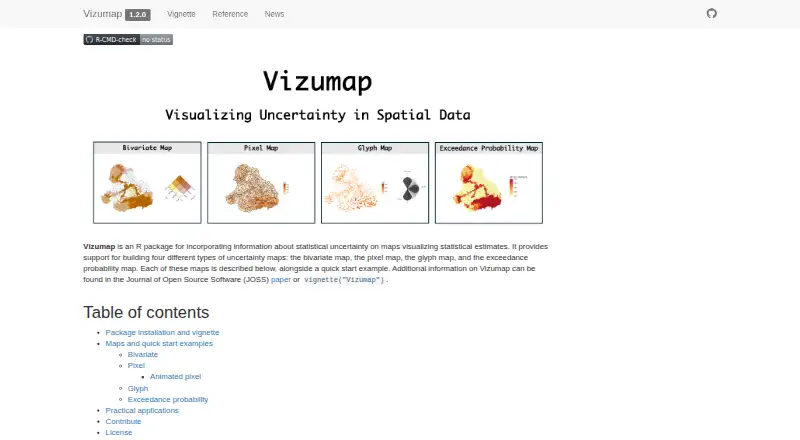
What Vizumap is
Vizumap is a free R package for showing statistical uncertainty on maps of statistical estimates. It works with data frames and geographic data, including shapefiles, and includes example data for predicted total suspended sediment loads and uncertainty in Queensland’s upper Burdekin catchment. Bivariate maps blend estimate and uncertainty into a 3×3 color grid. Pixel maps sample values from confidence or credible intervals inside geographic areas, making higher uncertainty look more pixelated; they can also be animated, with stronger flickering where uncertainty is high. Glyph maps use color for estimates and rotation for uncertainty, placing equal-sized glyphs at area centroids. Exceedance probability maps color areas by the probability of passing a selected threshold or target. The package is version 1.2.0 and licensed under GPLv3. Its site describes uses for catchment managers and policy makers and lists applications involving locusts, child undernutrition, and Ukrainian cropland and shipping.
Who it suits
Vizumap suits R users who need maps that communicate both estimates and their uncertainty. It is also aimed at communicating pollutant predictions to catchment managers and policy makers.
What it does well
- Free R package
- Four uncertainty-focused map types
- Animated pixel maps
- Works with shapefiles and data frames
- GPLv3 license
What to know first
- Scheduled refresh is not supported
- Requires R installation
- Pixel quick start uses the sf package
Verdict
Vizumap offers several visual encodings for uncertainty instead of showing estimates alone. Its free R package and example data provide a starting point for spatial analysis and communication.
Facts from Vizumap's own pages
- Animated maps
- Pixel maps can be animated across sampled values; areas with high uncertainty flicker more visibly than areas with low uncertainty. · lydialucchesi.github.io, 12 Oct 2026
- Animation
- Pixel maps can be animated, with high uncertainty appearing as visible flickering and low uncertainty appearing almost static. · lydialucchesi.github.io, 12 Oct 2026
- Applications
- The site lists published applications involving Australian plague locust abundance, child undernutrition in Bangladesh, and cropland productivity and shipping activity in Ukraine. · lydialucchesi.github.io, 12 Oct 2026
- Bivariate maps
- Bivariate maps blend colors for estimates and uncertainty into a 3×3 color grid, with each geographic area shown in one color. · lydialucchesi.github.io, 12 Oct 2026
- Citation
- The makers ask users who make or publish a map with Vizumap to cite Lucchesi et al. (2021), published in the Journal of Open Source Software. · lydialucchesi.github.io, 12 Oct 2026
- Contributions
- The project provides contribution guidelines and a Contributor Code of Conduct. · lydialucchesi.github.io, 12 Oct 2026
- Data sources
- Data frames and geographic data including shapefiles; bundled Burdekin example data · lydialucchesi.github.io, 23 Sept 2026
- Example audience
- The site describes communicating pollutant predictions and uncertainties to catchment managers and policy makers as a use for Vizumap. · lydialucchesi.github.io, 12 Oct 2026
- Example data
- The package includes example data on predicted total suspended sediment loads and prediction uncertainties from Queensland’s upper Burdekin catchment. · lydialucchesi.github.io, 12 Oct 2026
- Exceedance maps
- Exceedance probability maps color each geographic area according to the probability of exceeding a specified threshold or target. · lydialucchesi.github.io, 12 Oct 2026
- Free plan
- Yes · lydialucchesi.github.io, 23 Sept 2026
- Glyph maps
- Glyph maps use color for the estimate and rotation for uncertainty, placing equally sized glyphs at geographic-area centroids to give areas equal visual attention. · lydialucchesi.github.io, 12 Oct 2026
- Installation
- The site provides an installation command using remotes::install_github() for the lydialucchesi/Vizumap repository and instructions to open the package vignette in R. · lydialucchesi.github.io, 12 Oct 2026
- Integration
- The pixel map quick start loads the R package sf and uses its sf_use_s2 function. · lydialucchesi.github.io, 12 Oct 2026
- Intended users
- The site says its maps can communicate pollutant predictions and uncertainties to catchment managers and policy makers. · lydialucchesi.github.io, 12 Oct 2026
- License
- The site identifies Vizumap version 1.2.0 as licensed under GPLv3. · lydialucchesi.github.io, 12 Oct 2026
- Map types
- It supports bivariate, pixel, glyph, and exceedance probability maps. · lydialucchesi.github.io, 12 Oct 2026
- Pixel maps
- Pixel maps assign values sampled from an estimate’s confidence or credible interval to small pixels within geographic areas; higher uncertainty appears more pixelated. · lydialucchesi.github.io, 12 Oct 2026
- Product
- Vizumap is an R package for showing statistical uncertainty on maps of statistical estimates. · lydialucchesi.github.io, 12 Oct 2026
- Purpose
- Vizumap is an R package for adding statistical uncertainty information to maps of statistical estimates. · lydialucchesi.github.io, 12 Oct 2026
- Scheduled refresh
- No · lydialucchesi.github.io, 23 Sept 2026
Where Vizumap stands on Freedom251
- Data Visualization Software#78 of 98