Freedom251 › Data Visualization Software
Recharts
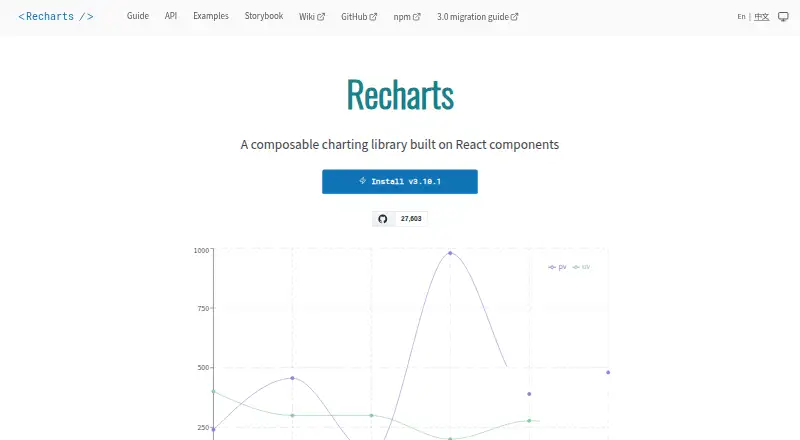
What Recharts is
Recharts is a free, open-source charting library for developers creating charts in React applications. It uses React components to compose displays from axes, tooltips, grids, legends, and chart series, with JavaScript object arrays as data sources. The API includes area, bar, line, pie, radar, scatter, funnel, treemap, Sankey, and sunburst charts. Rendering uses SVG elements together with lightweight D3 submodules. Component props and custom components provide customization options, while the responsive prop lets a chart adapt its SVG when the surrounding container changes size. The guide demonstrates hover tooltips for displaying information. API documentation describes keyboard-only and screen reader support, enabled by default for AreaChart. Installation guidance covers npm, single-page applications, Deno, and a UMD build. The project provides documentation, examples, Storybook, a wiki, and a migration guide. Recharts is released under the MIT License. The react-is dependency must match the installed React version.
Who it suits
Recharts suits React developers who need composable, customizable web charts and want an MIT-licensed library with documented examples and API resources.
What it does well
- Free MIT-licensed open source
- Many chart types
- Composable React components
- Responsive SVG sizing
- Keyboard and screen reader support
What to know first
- Designed for React applications
- react-is version must match React
- Uses JavaScript object arrays as data
- Accessibility default noted for AreaChart
Plans
| Plan | Billed and limits | Price |
|---|---|---|
| Recharts | MIT-licensed charting library; install via npm or use the UMD build | Free |
As recharts.github.io lists them, read 12 Oct 2026. The maker's own page has the final word.
Verdict
Recharts offers a broad chart API with React-based composition, SVG rendering, customization, and responsive behavior. Its documentation and examples support adoption, while React and dependency requirements define the intended environment.
Facts from Recharts's own pages
- Accessibility
- The chart API documents accessibility support for keyboard-only and screen reader users, enabled by default for AreaChart. · recharts.github.io, 12 Oct 2026
- Chart types
- Its API includes area, bar, line, pie, radar, scatter, funnel, treemap, Sankey, and sunburst charts. · recharts.github.io, 12 Oct 2026
- Components
- Charts are composed from separate components such as axes, tooltips, grids, legends, and chart series. · github.com, 12 Oct 2026
- Customization
- Charts can be customized through component props and custom components. · recharts.github.io, 12 Oct 2026
- Data sources
- JavaScript object arrays · recharts.github.io, 21 Sept 2026
- Installation
- The guide recommends installing Recharts with npm, including for single-page applications, and also documents a UMD build. · recharts.github.io, 12 Oct 2026
- Integrations
- The project README documents installation with npm or Deno, a UMD build, and use with React and D3. · github.com, 12 Oct 2026
- Intended users
- The project describes its purpose as helping developers write charts in React applications. · github.com, 12 Oct 2026
- Interactions
- The guide demonstrates tooltips for displaying information when a user hovers over a chart. · recharts.github.io, 12 Oct 2026
- License
- Recharts is released under the MIT License. · recharts.github.io, 12 Oct 2026
- Notable dependency requirement
- The repository installation instructions say react-is must match the version of the installed React package. · github.com, 12 Oct 2026
- Platform
- web · recharts.github.io, 21 Sept 2026
- Purpose
- Recharts is a composable charting library built on React components for adding charts to React applications. · recharts.github.io, 12 Oct 2026
- React dependency
- The project README says react-is must match the version of the installed React package. · github.com, 12 Oct 2026
- Rendering
- The library uses SVG elements and lightweight D3 submodules. · recharts.github.io, 12 Oct 2026
- Responsive sizing
- The responsive prop lets a chart adapt its SVG to changes in its container size. · recharts.github.io, 12 Oct 2026
- Support and learning
- The maker provides a guide, API reference, examples, Storybook, wiki, and migration guide through its site. · recharts.github.io, 12 Oct 2026
- Support resources
- The project links to documentation, examples, Storybook, a wiki, and a migration guide. · recharts.github.io, 12 Oct 2026
- What it does
- Recharts is a composable charting library built with React components for charts in React applications. · recharts.github.io, 12 Oct 2026
Where Recharts stands on Freedom251
- Data Visualization Software#38 of 98