Freedom251 › AI Agent Observability Tools
PetalTrace
What PetalTrace is
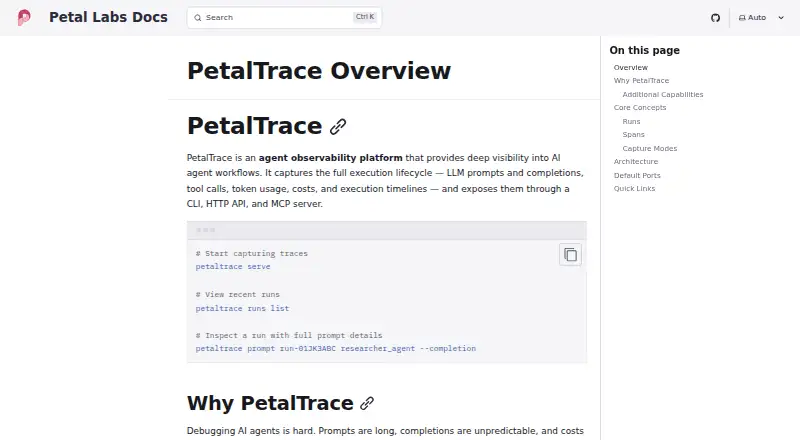
PetalTrace is an open-source observability platform for developers inspecting AI agent workflows. It captures prompts and completions, tool calls, token use, costs and execution timelines. A React web interface, CLI, HTTP API and MCP server provide ways to explore or query trace data. Full prompt capture can include system prompts, message history, tool definitions and model responses. Users can search prompt and completion text, compare runs for content and cost differences, and replay runs with different models or temperatures, including in mocked mode. It also accepts standard OpenTelemetry traces from instrumented applications, including those that do not use PetalFlow. PetalFlow integration adds graph topology, node-level inputs and outputs, and replay-capable snapshots. The documented local trace store uses SQLite. Documentation covers building from source or using a release binary and running a local daemon. Authentication is labeled future functionality and disabled by default; the public repository identifies an MIT license.
Who it suits
PetalTrace is intended for developers working with AI agent workflows who need to inspect traces, compare runs or replay executions. Its local deployment and disabled-by-default authentication are relevant considerations for teams evaluating where to run it.
What it does well
- Captures prompts, tool calls, token use and costs.
- Compares runs for content and cost differences.
- Replays runs with different models or temperatures.
- Accepts standard OpenTelemetry traces.
- The public repository identifies an MIT license.
What to know first
- Authentication is future functionality and disabled by default.
- Documented trace storage uses SQLite.
- No commercial pricing or usage limits are stated.
Limits
The public repository states no commercial pricing or usage limits. Configuration defaults retain runs for 30 days and failed runs for 90 days, with a maximum retention period of 365 days.
Plans
| Plan | Billed and limits | Price |
|---|---|---|
| PetalTrace | Public repository; no commercial pricing or usage limits stated | Free |
As docs.petallabs.io lists them, read 4 Oct 2026. The maker's own page has the final word.
Getting started
- Open the PetalTrace documentation website.
- Build PetalTrace from source with Go or download a release binary.
- Run the daemon locally.
- Use the React web interface, CLI, HTTP API, or MCP server to access traces.
Overview
PetalTrace is an open-source observability tool for developers who need to inspect and debug AI-agent workflows. It is strongest for teams that want detailed traces, run comparison, and replay in a self-managed setup; the main caution is that authentication is disabled by default.
A CLI, HTTP API, MCP server, and web interface put trace data within reach of both developers and AI agents. SQLite storage and local deployment suit teams that want control over their own trace store, but this is not the obvious choice for a team seeking a managed service with authentication ready to use.
Key features
PetalTrace records prompts and completions, tool calls, token usage, costs, and execution timelines. Full prompt capture includes system prompts, message history, and tool definitions, so developers can investigate what the model received as well as what it returned. PetalFlow users can choose minimal capture for latency, status, and token counts; standard capture adds prompts, completions, and tool I/O; full capture adds graph snapshots and edge data. That flexibility helps teams balance workflow context against the amount of interaction content they retain.
Run comparison identifies prompt, output, structural, and cost differences, while replay can use different models or temperatures and can run live, mocked, or hybrid. Together these tools make PetalTrace more useful for investigating a change than a trace viewer limited to post-run inspection. Costs can be tracked by workflow, provider, or model, and full-text search across prompts and completions plus real-time SSE feeds help with finding past activity and following active runs.
The MCP server lets agents query trace history, inspect prompts, analyze costs, compare runs, and trigger replays; the documentation includes Claude Code configuration. OpenTelemetry support also accepts standard OTLP traces from instrumented applications that do not use PetalFlow, broadening its reach beyond that integration. PetalFlow adds graph topology, node-level inputs and outputs, and replay-capable snapshots.
The documented store uses SQLite, with a default database at ~/.petaltrace/data.db. Retention defaults keep ordinary runs for 30 days and failed runs for 90 days, with a maximum of 365 days. Those defaults make retention a deployment setting to plan around, rather than an unlimited archive.
Pricing
PetalTrace is open source under the MIT license, and the PetalTrace plan is free. The public repository has no stated commercial pricing or usage limits. There is no paid tier to compare: the trade-off is between using a free, self-managed tool and accepting responsibility for its deployment and storage.
Installation is documented through building from source with Go or downloading a release binary and running the daemon locally. The React web UI and CLI provide ways to explore traces, costs, and workflow graphs, but the local deployment model and disabled-by-default authentication deserve careful consideration before exposing the service beyond a trusted environment.
Platforms
PetalTrace supports API, Linux, macOS, self-hosted, web, and Windows. Its CLI and HTTP API suit programmatic workflows, while the web UI provides a visual route into traces and workflow graphs. The MCP server adds agent-facing access; SQLite keeps the documented trace store local to the deployment.
Who it's for
PetalTrace is best suited to developers working on AI-agent workflows who need to understand prompts, tool activity, costs, and execution structure, then compare or replay runs while debugging. It is a particularly strong fit for PetalFlow users seeking graph context and for teams that want agents themselves to query trace history through MCP. Teams that need authentication enabled as a default deployment feature should look elsewhere or account for that limitation before deployment.
Pros and cons
- Pros: Captures prompts, tool calls, costs, and timelines, with configurable capture depth for PetalFlow users.
- Pros: Combines run comparison, replay, cost analysis, search, and active-run streaming in one developer-facing toolset.
- Pros: MCP access and standard OTLP support extend trace analysis to AI agents and OpenTelemetry-instrumented applications beyond PetalFlow.
- Cons: Authentication is disabled by default, a significant concern for deployments that are not kept within a trusted boundary.
- Cons: Local SQLite storage and documented local daemon deployment make operating and retaining trace data the team's responsibility.
Alternatives
OpenLIT is a reasonable alternative for teams who want an open-source option with unlimited self-hosted usage, users, projects, and environments, plus community support.
W&B Weave may suit teams that prefer a freemium plan with a stated monthly ingestion and storage allowance, alongside evaluations, tracing, and scorers.
Opik is worth considering if a team wants a free cloud plan or the option to download and run its open-source observability and evaluation features locally.
SigNoz is an alternative for teams seeking broader platform coverage; its community self-hosted plan leaves infrastructure, storage, scaling, upgrades, and backups to the user.
Agenta offers a free Hobby plan with stated team, run, evaluation, and trace-retention limits, which can help a small team judge a bounded allowance against its needs.
Arize AX may be a better fit for teams that prefer a SaaS free tier with stated trace-span, ingestion, issue, and retention limits.
Braintrust offers a free Starter plan with stated processed-data, score, and retention limits alongside unlimited users, projects, and datasets.
Galileo is another option for teams willing to consider a paid plan priced at $100 a month, billed yearly, with a stated monthly trace allowance and standard RBAC.
See also AI Agent Observability Tools for more options in this category.
Verdict
Choose PetalTrace if your team wants open-source, self-hosted observability that connects detailed agent traces to comparison and replay, especially with PetalFlow or an MCP-driven workflow. Its strongest reason to look elsewhere is operational: authentication is disabled by default, and the local deployment puts storage and retention in your hands.
Verdict
PetalTrace brings tracing, cost analysis, run comparison and replay into one developer-facing toolset. Teams considering deployment should account for authentication being disabled by default.
Questions
How much does PetalTrace cost?
PetalTrace is free. The listed plan is free.
Is PetalTrace open source?
Yes. The public repository identifies an MIT license.
Which platforms does it support?
The listed platforms are API, Linux, macOS, self-hosted, web, and Windows.
Can it work without PetalFlow?
Yes. PetalTrace accepts standard OTLP traces from any OpenTelemetry-instrumented application, including applications that do not use PetalFlow.
What interfaces does PetalTrace provide?
It provides a CLI, HTTP API, MCP server, and React-based web interface. The documentation includes Claude Code configuration for the MCP server.
Where are traces stored?
The documented architecture stores runs, spans, and LLM interactions in SQLite. The default database path is ~/.petaltrace/data.db.
Facts from PetalTrace's own pages
- Access methods
- The product exposes its capabilities through a CLI, HTTP API, and MCP server. · docs.petallabs.io, 3 Oct 2026
- Authentication
- The configuration reference labels authentication as future functionality and shows it disabled by default. · docs.petallabs.io, 4 Oct 2026
- Captured data
- It captures LLM prompts and completions, tool calls, token usage, costs, and execution timelines. · docs.petallabs.io, 3 Oct 2026
- Capture modes
- PetalFlow integration offers minimal capture for latency, status, and token counts; standard adds prompts, completions, and tool I/O; full adds graph snapshots and edge data. · docs.petallabs.io, 4 Oct 2026
- Cost tracking
- PetalTrace calculates costs for major providers and can track spending by workflow, provider, or model. · docs.petallabs.io, 3 Oct 2026
- Debugging
- It can compare workflow runs for structural, content, and cost differences and replay runs in live, mocked, or hybrid modes. · github.com, 4 Oct 2026
- Deployment
- The repository README documents building PetalTrace from source or downloading a release binary and running its daemon locally. · github.com, 3 Oct 2026
- Installation
- The getting-started guide documents building PetalTrace from source with Go; the repository also links downloadable release binaries. · docs.petallabs.io, 4 Oct 2026
- Integrations
- The MCP server lets AI agents query trace history, inspect prompts, analyze costs, compare runs, and trigger replays; the docs include Claude Code configuration. · docs.petallabs.io, 3 Oct 2026
- Intended users
- The documentation describes PetalTrace as an observability platform for developers working with AI agent workflows. · docs.petallabs.io, 4 Oct 2026
- Interfaces
- It provides a CLI, HTTP API, MCP server, and a React-based web UI for exploring traces, costs, and workflow graphs. · github.com, 4 Oct 2026
- License
- The public GitHub repository identifies an MIT license. · github.com, 4 Oct 2026
- Local storage
- The documented trace store uses SQLite, with a default database path of ~/.petaltrace/data.db. · docs.petallabs.io, 4 Oct 2026
- Maker
- Petal Labs' GitHub organization describes the company as building modular, composable tools for agentic AI systems and lists its location as the United States of America. · github.com, 3 Oct 2026
- MCP tools
- Its MCP server lets agents query traces, inspect prompts, analyze costs, compare runs, and trigger replays; the documentation shows Claude Code configuration. · docs.petallabs.io, 4 Oct 2026
- OpenTelemetry
- PetalTrace accepts standard OTLP traces over gRPC on port 4317 and HTTP on port 4318 from OTel-instrumented applications. · docs.petallabs.io, 4 Oct 2026
- PetalFlow integration
- PetalFlow integration adds graph topology, node-level inputs and outputs, and replay-capable snapshots. · docs.petallabs.io, 4 Oct 2026
- Product interface
- The repository README describes a React web UI for exploring traces, costs, and workflow graphs, alongside the CLI. · github.com, 3 Oct 2026
- Prompt inspection
- Full prompt capture includes system prompts, message history, tool definitions, and LLM responses. · docs.petallabs.io, 3 Oct 2026
- Purpose
- PetalTrace is an agent observability platform for inspecting AI agent workflows and their execution lifecycle. · docs.petallabs.io, 3 Oct 2026
- Replay
- Captured runs can be re-executed with different models or temperatures, or in mocked mode. · docs.petallabs.io, 3 Oct 2026
- Retention defaults
- Configuration defaults retain runs for 30 days, failed runs for 90 days, and allow a maximum retention period of 365 days. · docs.petallabs.io, 4 Oct 2026
- Run comparison
- It can compare two runs for prompt, output, and cost differences. · docs.petallabs.io, 3 Oct 2026
- Search and streaming
- It supports full-text search across prompts and completions and real-time SSE feeds for monitoring active runs. · docs.petallabs.io, 4 Oct 2026
Where PetalTrace stands on Freedom251
- AI Agent Observability Tools#22 of 31