Freedom251 › Data Visualization Software
graphlayouts
What graphlayouts is
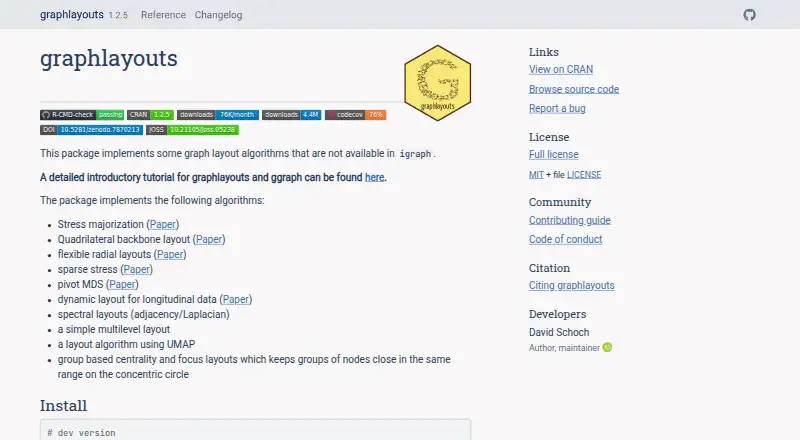
graphlayouts is a free R package that adds graph layout algorithms not available in igraph. It works with igraph networks and data from ggraph, igraphdata, and networkdata, and is listed for macOS and Windows desktop use. Available methods include stress majorization, backbone, flexible radial, sparse stress, pivot MDS, dynamic, spectral, multilevel, and UMAP-based layouts. Backbone uses edge embeddedness to emphasize possible group structures. Focus places nodes at equal distance from a chosen focal node on one circle, while centrality centers the node with the highest centrality and moves peripheral nodes outward. For large networks, pivot MDS uses a small set of pivot nodes, while sparse stress trades runtime for layout quality. Dynamic layout handles longitudinal snapshots by anchoring nodes to a reference arrangement and moving nodes as edges change. Examples combine graphlayouts with ggraph, igraph, and patchwork. Install from CRAN with install.packages("graphlayouts") or from GitHub with remotes::install_github("schochastics/graphlayouts"). R 3.6.0 or later, igraph 2.0.0 or later, and Rcpp are required.
Who it suits
graphlayouts suits R users who need additional network visualization layouts, including layouts for grouped, centrality-focused, large, or changing graphs.
What it does well
- Free package with no stated usage limits
- Many specialized graph layouts
- Supports dynamic network snapshots
- Works with igraph and ggraph
- CRAN and GitHub installation
What to know first
- Requires R 3.6.0 or later
- Requires igraph 2.0.0 or later and Rcpp
- Large-network guidance centers on under 100,000 nodes
- Desktop platforms listed are macOS and Windows
Plans
| Plan | Billed and limits | Price |
|---|---|---|
| graphlayouts (R package) | No paid plans or usage limits stated | Free |
As schochastics.github.io lists them, read 11 Oct 2026. The maker's own page has the final word.
Verdict
graphlayouts extends igraph with a broad set of layout methods for network analysis and visualization. Its requirements and platform listing should fit your R environment before installation.
Facts from graphlayouts's own pages
- Backbone layout
- The backbone layout uses edge embeddedness to help uncover and emphasize potential group structures. · schochastics.github.io, 11 Oct 2026
- Centrality layout
- The centrality layout places the node with the highest centrality at the center, with more peripheral nodes farther out. · schochastics.github.io, 11 Oct 2026
- Data sources
- igraph networks; ggraph; igraphdata; networkdata · schochastics.github.io, 23 Sept 2026
- Dynamic networks
- The dynamic layout visualizes longitudinal network snapshots by anchoring nodes to a reference layout and moving them slightly as edges change. · schochastics.github.io, 11 Oct 2026
- Focus layout
- The focus layout places nodes with the same distance from a focal node on the same circle. · schochastics.github.io, 11 Oct 2026
- Free plan
- Yes · schochastics.github.io, 23 Sept 2026
- Installation
- The package can be installed from CRAN with install.packages("graphlayouts") or from GitHub with remotes::install_github("schochastics/graphlayouts"). · schochastics.github.io, 11 Oct 2026
- Integrations
- The site demonstrates graphlayouts with ggraph and igraph, and also uses patchwork in examples. · schochastics.github.io, 11 Oct 2026
- Large networks
- The site describes two algorithms for large networks, with pivot MDS using a small number of pivot nodes and sparse stress trading runtime for layout quality. · schochastics.github.io, 11 Oct 2026
- Layout algorithms
- The package includes stress majorization, backbone, flexible radial, sparse stress, pivot MDS, dynamic, spectral, multilevel, and UMAP based layouts. · schochastics.github.io, 11 Oct 2026
- License
- The CRAN package listing identifies the license as MIT plus a license file. · stat.ethz.ch, 11 Oct 2026
- Limits
- The site describes its large graph algorithms in the context of networks under 100,000 nodes, while showing a sparse stress example with 165,000 nodes. · schochastics.github.io, 11 Oct 2026
- Platform
- desktop · schochastics.github.io, 23 Sept 2026
- Purpose
- graphlayouts implements graph layout algorithms that are not available in igraph. · schochastics.github.io, 11 Oct 2026
- Requirements
- The CRAN listing says the package depends on R 3.6.0 or later and imports igraph 2.0.0 or later and Rcpp. · stat.ethz.ch, 11 Oct 2026
- Support
- The project directs users to open a GitHub issue for bugs and support questions. · schochastics.github.io, 11 Oct 2026
Where graphlayouts stands on Freedom251
- Data Visualization Software#64 of 98