Freedom251 › Profiling Software
Go pprof
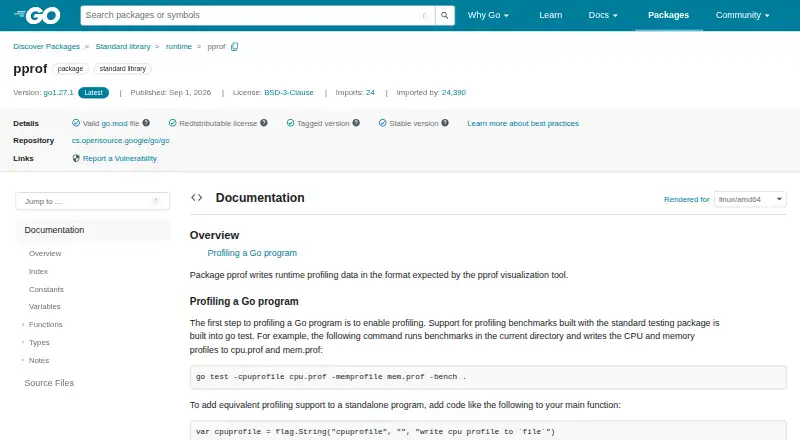
What Go pprof is
Go pprof is a free profiling package and analysis toolset for Go programs. The runtime/pprof package writes runtime profiling data in a format used by the pprof visualization tool, and Go’s testing package can generate CPU and memory profiles from benchmarks using go test flags. The net/http/pprof package serves live profiles through handlers under /debug/pprof/ and also provides execution trace data for go tool trace. Available profile types cover goroutines, goroutine leaks, allocations, heap use, thread creation, blocking, and mutex contention. The go tool pprof command can summarize program hot spots and open an interactive graph of hot spots and call graphs. Profile output can be written as a gzip-compressed protocol buffer or legacy text with function names and line numbers. Labels can be attached to contexts and goroutines, but only CPU and goroutine profiles currently use label information. Profile quality depends on kernel support. On Unix-like systems, CPU profiling does not work by default for Go code built with -buildmode=c-archive or -buildmode=c-shared. The package is self-hosted and licensed under BSD-3-Clause.
Who it suits
Go developers who need CPU, memory, goroutine, or other runtime profiles may find pprof useful. It suits teams prepared to interpret profiles with Go’s command-line tools and account for platform limitations.
What it does well
- Supports CPU and memory profiling.
- Serves live profiles through HTTP handlers.
- Can show hot spots as an interactive graph.
- Profile output supports protocol buffer and text formats.
What to know first
- Profile quality depends on kernel support.
- Unix-like c-archive and c-shared builds have a CPU profiling caveat.
- Only CPU and goroutine profiles use labels.
Limits
Profile quality depends on kernel support. On Unix-like systems, CPU profiling does not work by default for Go code built with -buildmode=c-archive or -buildmode=c-shared.
Getting started
- Open the Go pprof package documentation at https://pkg.go.dev/runtime/pprof.
- Use go test flags to write CPU or memory profiles for benchmarks.
- Import net/http/pprof to provide live profiles under /debug/pprof/.
- Analyze a program profile with go tool pprof binary profile.
- Use go tool trace with execution trace data served by the HTTP profiling package.
Verdict
Go pprof brings runtime profiling, live profile endpoints, and command-line visualization together for Go programs. Kernel support and the Unix-like build-mode limitation are worth considering for profiling plans.
Questions
How much does Go pprof cost?
It is free, and the package documentation lists a BSD-3-Clause license.
What can it profile?
Documented profiles include goroutines, goroutine leaks, allocations, heap use, thread creation, blocking, and mutex contention. CPU and memory profiles can also be produced for benchmarks.
Can it provide live profiles?
Yes. Importing net/http/pprof installs handlers under /debug/pprof/ for downloading live profiles.
How do I inspect a profile?
The Go command-line tool can interpret and display profiles. The pprof command includes a hot-spot summary and an interactive graph of hot spots and call graphs.
Does it support execution traces?
The HTTP profiling package serves execution trace data for use with the go tool trace command.
What are the CPU profiling caveats?
CPU profiling uses StartCPUProfile and StopCPUProfile because data streams to a writer. On Unix-like systems, it does not work by default for code built with -buildmode=c-archive or -buildmode=c-shared.
Facts from Go pprof's own pages
- Analysis tool
- The Go command-line tool interprets and displays profiles of Go programs and can be invoked as go tool pprof binary profile. · pkg.go.dev, 3 Oct 2026
- CPU and memory profiling
- Go’s testing package supports profiling benchmarks with go test flags that write CPU and memory profiles. · pkg.go.dev, 3 Oct 2026
- CPU profile limit
- CPU profiling uses StartCPUProfile and StopCPUProfile because CPU profiles stream output to a writer rather than appearing as a Profile. · pkg.go.dev, 3 Oct 2026
- CPU profiling
- StartCPUProfile enables CPU profiling for the current process and writes buffered profile data to an io.Writer. · pkg.go.dev, 4 Oct 2026
- Custom profiles
- Packages can create and maintain named profiles, commonly to track resources that must be explicitly closed, such as files or network connections. · pkg.go.dev, 4 Oct 2026
- Heap profiling
- The heap profile reports allocation statistics from the most recently completed garbage collection, subject to the documented no-GC exception. · pkg.go.dev, 4 Oct 2026
- HTTP integration
- Importing net/http/pprof installs handlers under /debug/pprof/ for downloading live profiles. · pkg.go.dev, 4 Oct 2026
- HTTP profiles
- The net/http/pprof package serves live runtime profiles through HTTP handlers under /debug/pprof/. · pkg.go.dev, 3 Oct 2026
- Kernel caveat
- The documentation cautions that profiles are only as good as the kernel support used to generate them. · pkg.go.dev, 3 Oct 2026
- Labels
- Context labels can be attached to profiling data, and the documentation says only CPU and goroutine profiles currently use label information. · pkg.go.dev, 4 Oct 2026
- License
- The package documentation lists the license as BSD-3-Clause. · pkg.go.dev, 3 Oct 2026
- License and project
- Go is an open source project developed by a team at Google and community contributors, distributed under a BSD-style license. · go.dev, 4 Oct 2026
- Limits
- The documentation cautions that profile quality depends on kernel support and notes a Unix-like c-archive/c-shared CPU profiling limitation involving SIGPROF. · pkg.go.dev, 4 Oct 2026
- Platform caveat
- On Unix-like systems, CPU profiling does not work by default for Go code built with -buildmode=c-archive or -buildmode=c-shared. · pkg.go.dev, 3 Oct 2026
- Profile format
- Profile.WriteTo can emit a gzip-compressed protocol buffer or a legacy text format with function names and line numbers. · pkg.go.dev, 3 Oct 2026
- Profile output
- Profile.WriteTo can write gzip-compressed protocol buffer data or a legacy text format, depending on its debug argument. · pkg.go.dev, 4 Oct 2026
- Profiles
- Predefined profiles cover goroutines, memory allocations, OS thread creation, blocking, and mutex contention. · pkg.go.dev, 4 Oct 2026
- Profile types
- The documented predefined profiles include goroutine, goroutineleak, allocs, heap, threadcreate, block, and mutex. · pkg.go.dev, 3 Oct 2026
- Purpose
- The runtime/pprof package writes runtime profiling data in the format expected by the pprof visualization tool. · pkg.go.dev, 4 Oct 2026
- Security reporting
- The Go project directs security-related reports to [email protected] and links to its security policy. · go.dev, 4 Oct 2026
- Support and community
- The Go project lists user discussion, developer, and code review mailing lists, and directs bug reports to its issue tracker. · go.dev, 4 Oct 2026
- Trace integration
- The HTTP profiling package serves execution trace data for use with the go tool trace command. · pkg.go.dev, 3 Oct 2026
- Visualization
- The Go documentation describes using go tool pprof to inspect profiles, including a top summary and an interactive call graph. · pkg.go.dev, 4 Oct 2026
Where Go pprof stands on Freedom251
- Profiling Software#15 of 29